1 / 8
1728 7th ST, C, Berkeley, CA 94710
$475K2bd · 1ba · 620 sqft
Lot 0 sqft•HOA $499/mo•Condominium•Active•158d on market•MLS# 00-41136481
1728 7th ST, C, Berkeley, CA 94710
MLS# 00-41136481•Residential•Condominium
Active158 days on market
$475,000
2
Beds
1
Baths
620
Sq Ft
0
Lot Sq Ft
$499
HOA/mo
1963
Year Built
Water
View
Property Description
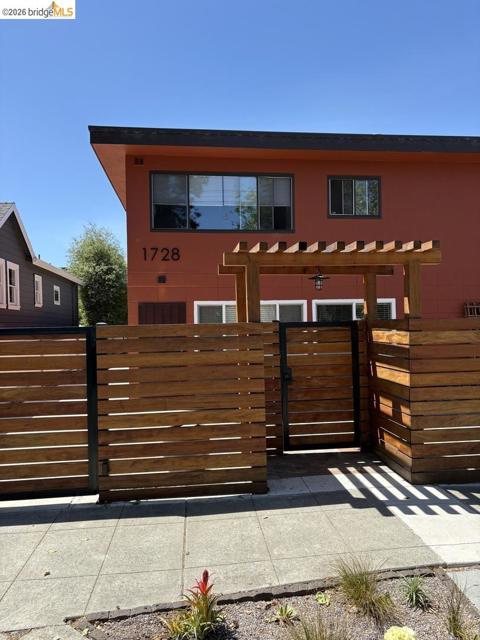
Fantastic opportunity at below market price! Remodeled unit with real hardwood flooring, new paint and recessed lighting, located in a great location in a secured gated access building with new roof, new driveway, new electric main ,new tiled patios and freshly painted. Transparent pricing.
Features & Amenities
FeeBuilt 1963
Property Details
Land Type
Fee
Year Built
1963
Property Type
Residential
Property Subtype
Condominium
Heating
Wall Furnace
View
Water
Flooring
Wood
Roof
Composition
City
Berkeley
Zip Code
94710
County
Alameda
Mortgage Calculator
Current Rates
$
$
%
Monthly Payment
$2,401.86
Principal & Interest
Loan Amount
$380,000
Total Interest
$484,669
Total Payment Over 30 Years
$864,669
This calculator provides estimates only. Actual mortgage payments may include taxes, insurance, HOA fees, and PMI. Contact a lender for accurate quotes.
Comparative Market Analysis
Affordable Tier · 5 active · 5 closed
1728 7th ST, C, Berkeley, CA 94710
Berkeley · Condominium
$475K
Affordable TierBeds
2
Baths
1
Sqft
620
Lot
0 sqft
Year
1963
$/Sqft
$766
Pool: No✓
View: water✓
Listed 3.5% above the median closed sale of $459,000. Closed comps sold at 105% of list — strong seller's market.
Price Position
Aligned with the market — fair pricing for the comps.
At market
Subject listed at $475K· $766/sqft
Total list price
Closed comps
vs closed median $459K
+$16K (+3.5%)
Active comps
vs active median $495K
−$20K (−4.0%)
Price per sqft
Closed compsinsufficient comp data
Active comps
vs active avg $/sqft $649
+$117 (+18.0%)
Active Properties (5)
Active Comparables
| Address | City | Year | BD | BTH | SqFt | LotSz | LP/SqFt | LP | DIM | Score |
|---|---|---|---|---|---|---|---|---|---|---|
| 2218 Parker St | Berkeley | 1963 | 2 | 1 | 635 | 6,750 | $843 | $535,000 | 53 | 77 |
| 1314 4th St | Berkeley | 1910 | 1 | 1 | 758 | 0 | $567 | $429,900 | 87 | 74 |
| 1901 Parker St | Berkeley | 1930 | 2 | 1 | 764 | 8,813 | $653 | $499,000 | 137 | 68 |
| 417 Evelyn Ave | Albany | 1988 | 1 | 1 | 688 | 15,173 | $651 | $448,000 | 116 | 67 |
| 555 Pierce St | Albany | 1977 | 2 | 2 | 933 | 318,666 | $531 | $495,000 | 79 | 63 |
| Total: 5 · Average | 1.6 | 1.2 | 755.6 | 87,350.5 | $649 | $481,380 | 94.4 | |||
| Median | 758 | $495,000 | ||||||||
Closed Properties (5)
Closed Comparables
| Address | City | Year | Date | BD | BTH | SqFt | LotSz | LP | SP | SP/SqFt | SP/LP | DIM | Score |
|---|---|---|---|---|---|---|---|---|---|---|---|---|---|
| 1266 62nd St | Emeryville | 1964 | 06/01/2026 | 2 | 1 | 642 | 6,555 | $375,000 | $415,000 | $646 | 1.11 | 57 | 77 |
| 2112 Mckinley Ave | Berkeley | 1985 | 06/29/2026 | 0 | 1 | 555 | 6,272 | $459,000 | $459,000 | $827 | 1.00 | 94 | 70 |
| 2366 Cedar St | Berkeley | 1926 | 08/10/2026 | 1 | 1 | 500 | 7,456 | $525,000 | $532,000 | $1,064 | 1.01 | 66 | 63 |
| 1849 Shattuck Ave | Berkeley | 1996 | 07/06/2026 | 1 | 1 | 490 | 6,359 | $370,000 | $430,000 | $878 | 1.16 | 27 | 63 |
| 2747 San Pablo Ave | Berkeley | 2020 | 06/22/2026 | 1 | 1 | 826 | 17,390 | $510,000 | $505,000 | $611 | 0.99 | 95 | 63 |
| Total: 5 · Average | 1.0 | 1.0 | 602.6 | 8,806.4 | $468,200 | $468,200 | $805.2 | — | 67.8 | ||||
| Median | 555 | $459,000 | $459,000 | ||||||||||
Market Analysis
List vs Sale $/SqFt
Sale Price Trend
Days on Market
Sale vs List Price
AI-generated CMA
This analysis was generated automatically from MLS data. For an in-depth, human-reviewed valuation, contact Joseph Sardella at josephsardella@gmail.com.