1 / 2
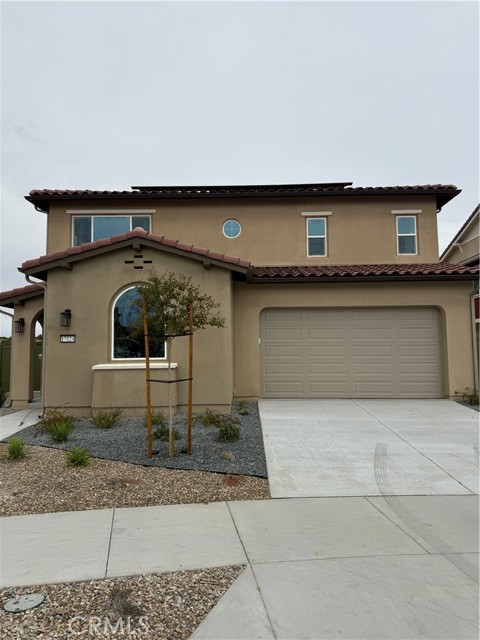
17124 Kent, Hesperia, CA 92345
$666K4bd · 4ba · 3,018 sqft
Lot 8,048 sqft•HOA $157/mo•Single Family Residence•Active•48d on market•MLS# OC-26202510
17124 Kent, Hesperia, CA 92345
MLS# OC-26202510•Residential•Single Family Residence
Active48 days on market
$666,070
4
Beds
4
Baths
3,018
Sq Ft
8,048
Lot Sq Ft
$157
HOA/mo
2026
Year Built
Hills
View
Property Description
Close OUT SALE! ACT FAST!
Features & Amenities
FeeBuilt 2026
Property Details
Land Type
Fee
Year Built
2026
Property Type
Residential
Property Subtype
Single Family Residence
Parking Spaces
2
Garage Spaces
2
Cooling
Central Air
View
Hills
City
Hesperia
Zip Code
92345
County
San Bernardino
Mortgage Calculator
Current Rates
$
$
%
Monthly Payment
$3,368.01
Principal & Interest
Loan Amount
$532,856
Total Interest
$679,628
Total Payment Over 30 Years
$1,212,484
This calculator provides estimates only. Actual mortgage payments may include taxes, insurance, HOA fees, and PMI. Contact a lender for accurate quotes.
Comparative Market Analysis
Luxury Tier · 5 active · 5 closed
17124 Kent, Hesperia, CA 92345
Hesperia · Single Family Residence
$666K
Luxury TierBeds
4
Baths
4
Sqft
3,018
Lot
8,048 sqft
Year
2026
$/Sqft
$221
Pool: No✓
View: Hills✓
Garage: 2-car✓
Listed 5.8% above the median closed sale of $629,705. Closed comps sold at 101% of list — strong seller's market. Expect a longer timeline — comps averaged 244 days on market. Luxury tier — fewer comparable sales widen the confidence range.
Price Position
Positioned above the market — commands a premium.
Premium
Subject listed at $666K· $221/sqft
Total list price
Closed comps
vs closed median $630K
+$36K (+5.8%)
Active comps
vs active median $618K
+$48K (+7.8%)
Price per sqft
Closed compsinsufficient comp data
Active comps
vs active avg $/sqft $265
−$44 (−16.7%)
Active Properties (5)
Active Comparables
| Address | City | Year | BD | BTH | SqFt | LotSz | LP/SqFt | LP | DIM | Score |
|---|---|---|---|---|---|---|---|---|---|---|
| 6458 Marlebrook | Hesperia | 2026 | 4 | 4 | 3,018 | 7,664 | $225 | $678,920 | 46 | 95 |
| 6470 Marblebrook | Hesperia | 2026 | 3 | 3 | 2,247 | 7,671 | $275 | $618,030 | 47 | 90 |
| 6446 Marblebrook | Hesperia | 2026 | 3 | 3 | 2,247 | 7,628 | $267 | $599,240 | 47 | 90 |
| 11490 4th | Hesperia | 1991 | 4 | 2 | 1,959 | 43,560 | $291 | $570,000 | 58 | 65 |
| 9037 5th Avenue | Hesperia | 1956 | 5 | 3 | 2,363 | 46,133 | $269 | $635,900 | 20 | 61 |
| Total: 5 · Average | 3.8 | 3.0 | 2,366.8 | 22,531.2 | $265.4 | $620,418 | 43.6 | |||
| Median | 2,247 | $618,030 | ||||||||
Closed Properties (5)
Closed Comparables
| Address | City | Year | Date | BD | BTH | SqFt | LotSz | LP | SP | SP/SqFt | SP/LP | DIM | Score |
|---|---|---|---|---|---|---|---|---|---|---|---|---|---|
| 17163 Kent Street | Hesperia | 2025 | 12/31/2025 | 4 | 4 | 3,030 | 10,041 | $634,990 | $634,990 | $210 | 1.00 | 169 | 92 |
| 17136 Kent Street | Hesperia | 2026 | 07/28/2026 | 5 | 4 | 3,539 | 7,245 | $724,570 | $724,820 | $205 | 1.00 | 186 | 91 |
| 8802 Waltham Street | Hesperia | 2025 | 07/30/2026 | 4 | 3 | 2,650 | 8,787 | $581,425 | $581,928 | $220 | 1.00 | 303 | 89 |
| 8863 Glencliff Avenue | Hesperia | 2024 | 11/26/2025 | 4 | 3 | 3,110 | 7,234 | $574,990 | $574,990 | $185 | 1.00 | 336 | 89 |
| 8878 Waltham Avenue | Hesperia | 2025 | 03/18/2026 | 4 | 3 | 3,110 | 10,662 | $609,151 | $629,705 | $202 | 1.03 | 226 | 86 |
| Total: 5 · Average | 4.2 | 3.4 | 3,087.8 | 8,793.8 | $629,286.6 | $629,286.6 | $204.4 | — | 244 | ||||
| Median | 3,110 | $629,705 | $629,705 | ||||||||||
Market Analysis
List vs Sale $/SqFt
Sale Price Trend
Days on Market
Sale vs List Price
AI-generated CMA
This analysis was generated automatically from MLS data. For an in-depth, human-reviewed valuation, contact Joseph Sardella at josephsardella@gmail.com.