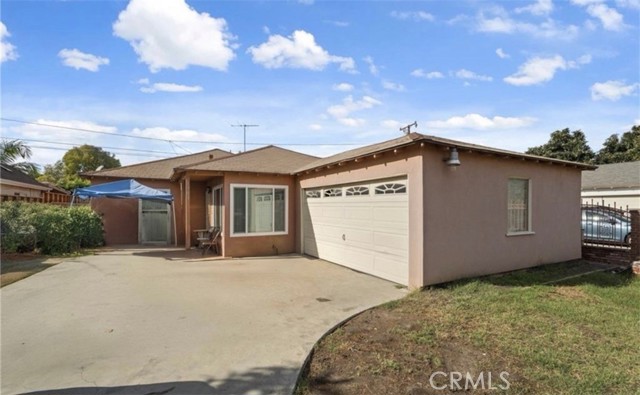
1701 North Paulsen, Compton, CA 90222
1701 North Paulsen, Compton, CA 90222
Property Description
Opportunity awaits! This property is recored as a 4 bedroom 2 bath, It is currently configured as a spacious 3/2. This 3-bedroom, 2-bathroom home is a fantastic fixer-upper with plenty of potential to create your dream home or add value as an investment property. Featuring a functional layout and generous living space, this property offers a great starting point for renovation and personalization. Bring your vision and creativity to transform this home with modern updates, stylish finishes, and your own personal touch. Whether you’re an investor, first-time buyer looking for a project, or someone searching for a home with upside potential, this property is worth a closer look.
Features & Amenities
Property Details
Mortgage Calculator
Current Rates
Comparative Market Analysis
Residential Tier · 5 active · 5 closed
Compton · Single Family Residence
Listed 4.6% below the median closed sale of $644,900. Price per sqft ($394) is a 23% discount to closed comps ($513). Closed comps sold at 100% of list — strong seller's market.
Price Position
Aligned with the market — fair pricing for the comps.
Active Properties (5)
Active Comparables
| Address | City | Year | BD | BTH | SqFt | LotSz | LP/SqFt | LP | DIM | Score |
|---|---|---|---|---|---|---|---|---|---|---|
| 938 138th Street | Compton | 1954 | 3 | 2 | 1,393 | 6,286 | $467 | $649,900 | 17 | 89 |
| 2055 Nord | Compton | 1964 | 3 | 2 | 1,298 | 4,942 | $531 | $689,000 | 29 | 89 |
| 815 134th | Compton | 1953 | 3 | 2 | 1,199 | 5,799 | $496 | $595,000 | 33 | 88 |
| 1001 133rd | Compton | 1950 | 3 | 2 | 1,345 | 5,833 | $461 | $620,000 | 79 | 88 |
| 2211 Grape Ave | Compton | 1947 | 4 | 3 | 2,018 | 5,001 | $343 | $693,000 | 41 | 87 |
| Total: 5 · Average | 3.2 | 2.2 | 1,450.6 | 5,572.2 | $459.6 | $649,380 | 39.8 | |||
| Median | 1,345 | $649,900 | ||||||||
Closed Properties (5)
Closed Comparables
| Address | City | Year | Date | BD | BTH | SqFt | LotSz | LP | SP | SP/SqFt | SP/LP | DIM | Score |
|---|---|---|---|---|---|---|---|---|---|---|---|---|---|
| 901 134th Place | Compton | 1950 | 10/21/2026 | 3 | 2 | 1,332 | 5,802 | $624,900 | $644,900 | $484 | 1.03 | 54 | 91 |
| 440 Cherry | Compton | 1941 | 08/05/2026 | 3 | 2 | 1,283 | 4,996 | $600,000 | $607,500 | $473 | 1.01 | 61 | 88 |
| 850 132nd | Compton | 1948 | 07/31/2026 | 3 | 3 | 1,458 | 4,545 | $655,000 | $650,000 | $446 | 0.99 | 160 | 87 |
| 13409 Willowbrook ave | Willowbrook | 1949 | 06/23/2026 | 3 | 2 | 1,187 | 3,469 | $599,000 | $605,000 | $510 | 1.01 | 54 | 83 |
| 1903 Grape Avenue | Compton | 1947 | 08/18/2026 | 2 | 1 | 1,042 | 5,400 | $700,000 | $680,000 | $653 | 0.97 | 71 | 82 |
| Total: 5 · Average | 2.8 | 2.0 | 1,260.4 | 4,842.4 | $637,480 | $637,480 | $513.2 | — | 80 | ||||
| Median | 1,283 | $644,900 | $644,900 | ||||||||||
Market Analysis
List vs Sale $/SqFt
Sale Price Trend
Days on Market
Sale vs List Price
This analysis was generated automatically from MLS data. For an in-depth, human-reviewed valuation, contact Joseph Sardella at josephsardella@gmail.com.