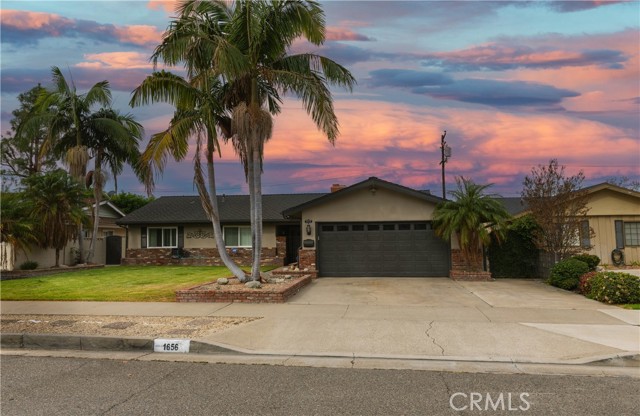
1656 North Shaffer, Orange, CA 92867
1656 North Shaffer, Orange, CA 92867
Property Description
Welcome to this beautifully upgraded single-story home located in the heart of Orange County. Featuring 4 bedrooms and 2 bathrooms, this residence offers the perfect blend of comfort, style, and functionality. Step inside to discover an inviting open floor plan with abundant natural light, modern upgrades, and thoughtfully designed living spaces. The updated kitchen flows seamlessly into the dining and living areas, creating an ideal setting for both everyday living and entertaining. Outside, enjoy your own private backyard oasis complete with a sparkling pool, perfect for relaxing, hosting family gatherings, or making the most of Southern California's year-round sunshine. The generous lot provides ample space for outdoor dining, and recreation. Conveniently located near top-rated schools, parks, shopping, dining, and major freeways, this exceptional home offers the best of Orange County living.
Features & Amenities
Property Details
Mortgage Calculator
Current Rates
Comparative Market Analysis
Luxury Tier · 5 active · 5 closed
Orange · Single Family Residence
Listed 7.1% above the median closed sale of $1,680,000. Price per sqft ($962) is a 16% premium to closed comps ($829). Closed comps sold at 101% of list — strong seller's market. Luxury tier — fewer comparable sales widen the confidence range.
Price Position
Positioned above the market — commands a premium.
Active Properties (5)
Active Comparables
| Address | City | Year | BD | BTH | SqFt | LotSz | LP/SqFt | LP | DIM | Score |
|---|---|---|---|---|---|---|---|---|---|---|
| 842 Glendale | Orange | 1962 | 4 | 2 | 1,727 | 8,600 | $981 | $1.70M | 11 | 81 |
| 831 Hoover | Orange | 1961 | 5 | 3 | 2,324 | 8,190 | $731 | $1.70M | 58 | 77 |
| 1195 Lincoln | Orange | 1964 | 4 | 3 | 2,601 | 11,000 | $759 | $1.98M | 17 | 76 |
| 1467 Kathleen | Orange | 1964 | 4 | 2 | 2,020 | 7,400 | $767 | $1.55M | 99 | 68 |
| 1972 Fern Street | Orange | 1964 | 4 | 4 | 3,000 | 8,640 | $632 | $1.90M | 24 | 63 |
| Total: 5 · Average | 4.2 | 2.8 | 2,334.4 | 8,766 | $774 | $1.76M | 41.8 | |||
| Median | 2,324 | $1.70M | ||||||||
Closed Properties (5)
Closed Comparables
| Address | City | Year | Date | BD | BTH | SqFt | LotSz | LP | SP | SP/SqFt | SP/LP | DIM | Score |
|---|---|---|---|---|---|---|---|---|---|---|---|---|---|
| 626 Palmdale | Orange | 1962 | 07/24/2026 | 4 | 2 | 1,660 | 8,000 | $1.63M | $1.60M | $964 | 0.98 | 29 | 89 |
| 1760 Silverwood | Orange | 1966 | 04/30/2026 | 4 | 3 | 2,600 | 9,010 | $1.60M | $1.61M | $619 | 1.01 | 48 | 83 |
| 1830 Ridgewood Street | Orange | 1962 | 05/28/2026 | 4 | 2 | 1,647 | 8,500 | $1.70M | $1.68M | $1,020 | 0.99 | 93 | 81 |
| 2704 North Vista Heights Avenue | Orange | 1986 | 06/17/2026 | 4 | 3 | 2,179 | 8,000 | $1.60M | $1.79M | $821 | 1.12 | 40 | 74 |
| 634 East Adams Avenue | Orange | 1957 | 07/15/2026 | 5 | 6 | 2,700 | 9,100 | $2.00M | $1.94M | $719 | 0.97 | 135 | 74 |
| Total: 5 · Average | 4.2 | 3.2 | 2,157.2 | 8,522 | $1.72M | $1.72M | $828.6 | — | 69 | ||||
| Median | 2,179 | $1.68M | $1.68M | ||||||||||
Market Analysis
List vs Sale $/SqFt
Sale Price Trend
Days on Market
Sale vs List Price
This analysis was generated automatically from MLS data. For an in-depth, human-reviewed valuation, contact Joseph Sardella at josephsardella@gmail.com.