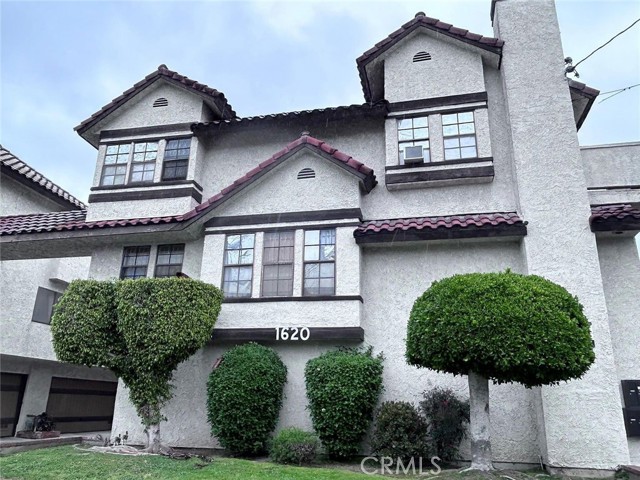
1620 South 5th, F, Alhambra, CA 91803
1620 South 5th, F, Alhambra, CA 91803
Property Description
Total of 1600+ square feet of indoor space, including an extra bonus room with finished lower-level space of about 250 sq. ft. that is not included in the published square footage. This south-facing, well-maintained 3-bedroom, 3-bathroom townhome is a comfortable and convenient place to call home in one of Alhambra’s most desirable areas. It features a high-ceiling living room with a fireplace, a separate dining area, lots of natural light, and a two-car garage with new doors. The primary bedroom suite includes a walk-in closet and a private balcony for relaxing. Located just minutes from shopping and dining on Valley Blvd., the home offers a great balance of convenience and livability. With low property taxes and an HOA that includes water and trash, this is a rare move-in-ready opportunity.
Features & Amenities
Property Details
Mortgage Calculator
Current Rates
Comparative Market Analysis
Affordable Tier · 5 active · 5 closed
Alhambra · Townhouse
Listed 4.9% below the median closed sale of $735,000.
Price Position
Aligned with the market — fair pricing for the comps.
Active Properties (5)
Active Comparables
| Address | City | Year | BD | BTH | SqFt | LotSz | LP/SqFt | LP | DIM | Score |
|---|---|---|---|---|---|---|---|---|---|---|
| 504 Monterey | Alhambra | 1981 | 3 | 3 | 1,427 | 15,510 | $473 | $675,000 | 18 | 88 |
| 108 Moore Avenue | Monterey Park | 1981 | 3 | 3 | 1,502 | 19,979 | $485 | $729,000 | 29 | 87 |
| 704 Electric | Alhambra | 1991 | 3 | 3 | 1,228 | 7,949 | $550 | $675,000 | 26 | 85 |
| 25 Palmetto Drive | Alhambra | 1987 | 3 | 3 | 1,200 | 30,318 | $582 | $698,000 | 80 | 83 |
| 332 Pomelo Avenue | Monterey Park | 1978 | 3 | 3 | 1,433 | 19,123 | $481 | $689,000 | 118 | 83 |
| Total: 5 · Average | 3.0 | 3.0 | 1,358 | 18,575.8 | $514.2 | $693,200 | 54.2 | |||
| Median | 1,427 | $689,000 | ||||||||
Closed Properties (5)
Closed Comparables
| Address | City | Year | Date | BD | BTH | SqFt | LotSz | LP | SP | SP/SqFt | SP/LP | DIM | Score |
|---|---|---|---|---|---|---|---|---|---|---|---|---|---|
| 511 Mcpherrin Avenue | Monterey Park | 1984 | 10/15/2026 | 3 | 3 | 1,561 | 19,769 | $749,000 | $749,000 | $480 | 1.00 | 84 | 89 |
| 226 Chandler | Monterey Park | 1983 | 10/09/2026 | 3 | 3 | 1,449 | 20,682 | $750,000 | $778,000 | $537 | 1.04 | 79 | 89 |
| 322 Huntington | Monterey Park | 1981 | 02/19/2026 | 3 | 3 | 1,385 | 13,565 | $698,000 | $695,000 | $502 | 1.00 | 39 | 85 |
| 431 Alhambra | Monterey Park | 1981 | 05/01/2026 | 3 | 3 | 1,469 | 33,800 | $749,000 | $735,000 | $500 | 0.98 | 38 | 83 |
| 919 San Marino Avenue | Alhambra | 1980 | 02/12/2026 | 3 | 3 | 1,373 | 9,777 | $650,000 | $632,000 | $460 | 0.97 | 73 | 83 |
| Total: 5 · Average | 3.0 | 3.0 | 1,447.4 | 19,518.6 | $717,800 | $717,800 | $495.8 | — | 62.6 | ||||
| Median | 1,449 | $735,000 | $735,000 | ||||||||||
Market Analysis
List vs Sale $/SqFt
Sale Price Trend
Days on Market
Sale vs List Price
This analysis was generated automatically from MLS data. For an in-depth, human-reviewed valuation, contact Joseph Sardella at josephsardella@gmail.com.