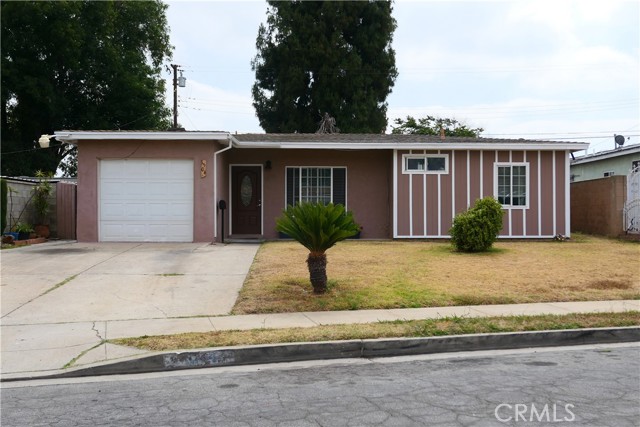
1504 South Haskins, Compton, CA 90220
1504 South Haskins, Compton, CA 90220
Property Description
Refreshed remodeled home, the perfect opportunity for a family seeking a true move-in ready property with room to grow in the future. Two families can move in, second kitchen and bathroom in the studio room, The large rear yard is secured by an brick wall fence, excellent security and privacy. 3 bedroom and 1 Bath home. Remodeled Kitchen, New floors, Painted throughout, Great for building an ADU, ample space. Enjoy a patio bring your BBQ grill and umbrellas. Fruit trees orange, avocado and guayaba. Large driveway with detached garage to park RV or several cars. Move in condition, home located in a quiet secluded street. Located in a centralized location near schools, shopping, entertainment, near downtown shopping entertainment, and freeways. Offering the blend of comfort, privacy and convenience. Wonderfully opportunity to make your homeownership dreams a reality.
Features & Amenities
Property Details
Mortgage Calculator
Current Rates
Comparative Market Analysis
Affordable Tier · 5 active · 5 closed
Compton · Single Family Residence
Listed in line with the median closed sale of $650,000. Price per sqft ($720) is a 16% premium to closed comps ($622). Closed comps sold at 104% of list — strong seller's market.
Price Position
Aligned with the market — fair pricing for the comps.
Active Properties (5)
Active Comparables
| Address | City | Year | BD | BTH | SqFt | LotSz | LP/SqFt | LP | DIM | Score |
|---|---|---|---|---|---|---|---|---|---|---|
| 2430 Bennett | Compton | 1950 | 3 | 2 | 1,008 | 6,380 | $723 | $729,000 | 38 | 90 |
| 333 158th | Gardena | 1954 | 2 | 1 | 880 | 7,530 | $795 | $700,000 | 2 | 88 |
| 2634 Billings | Compton | 1959 | 3 | 2 | 1,066 | 5,108 | $656 | $699,000 | 51 | 86 |
| 1310 Tichenor | Compton | 1949 | 2 | 1 | 1,032 | 6,520 | $619 | $639,000 | 12 | 83 |
| 725 Taper | Compton | 1950 | 3 | 2 | 1,300 | 6,002 | $516 | $670,888 | 2 | 82 |
| Total: 5 · Average | 2.6 | 1.6 | 1,057.2 | 6,308 | $661.8 | $687,577.6 | 21 | |||
| Median | 1,032 | $699,000 | ||||||||
Closed Properties (5)
Closed Comparables
| Address | City | Year | Date | BD | BTH | SqFt | LotSz | LP | SP | SP/SqFt | SP/LP | DIM | Score |
|---|---|---|---|---|---|---|---|---|---|---|---|---|---|
| 2904 Caldwell Street | Compton | 1953 | 09/30/2026 | 3 | 1 | 867 | 6,184 | $620,000 | $620,000 | $715 | 1.00 | 55 | 98 |
| 2606 Caldwell | Compton | 1951 | 09/11/2026 | 2 | 1 | 796 | 5,054 | $619,000 | $645,000 | $810 | 1.04 | 29 | 90 |
| 2714 Tichenor | Compton | 1951 | 09/29/2026 | 3 | 1 | 1,129 | 5,201 | $639,999 | $650,000 | $576 | 1.02 | 68 | 89 |
| 909 Nordby Street | Carson | 1957 | 10/21/2026 | 4 | 2 | 1,198 | 6,593 | $630,000 | $732,500 | $611 | 1.16 | 41 | 78 |
| 1415 Mckinley Avenue | Compton | 1951 | 07/17/2026 | 3 | 2 | 1,852 | 5,669 | $740,000 | $740,000 | $400 | 1.00 | 50 | 70 |
| Total: 5 · Average | 3.0 | 1.4 | 1,168.4 | 5,740.2 | $677,500 | $677,500 | $622.4 | — | 48.6 | ||||
| Median | 1,129 | $650,000 | $650,000 | ||||||||||
Market Analysis
List vs Sale $/SqFt
Sale Price Trend
Days on Market
Sale vs List Price
This analysis was generated automatically from MLS data. For an in-depth, human-reviewed valuation, contact Joseph Sardella at josephsardella@gmail.com.