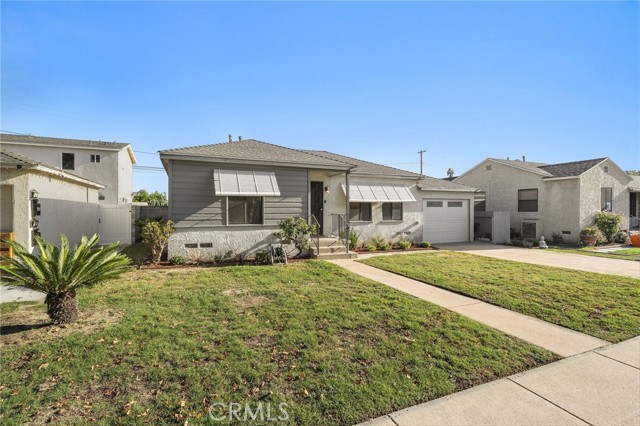
149 E. 59th Street, Long Beach, CA 90805
149 E. 59th Street, Long Beach, CA 90805
Property Description
Welcome to 149 E. 59th Street in Long Beach! This charming home offers 2 bedrooms and 1 bathroom, blending classic character with thoughtful updates and room to make it your own. The spacious backyard features various citrus trees and plenty of room for entertaining, gardening, or exploring the potential for an ADU. Recent upgrades include a newer roof and an upgraded 200-amp electrical panel. The permitted garage remodel features epoxy flooring and a heating and cooling split unit, creating an additional flexible space for a home office or workshop. An exterior 240-volt outlet is ready for EV charging. This home is conveniently located near DeForest Park and the DeForest Wetlands, with access to walking trails, outdoor recreation and MORE!
Features & Amenities
Property Details
Mortgage Calculator
Current Rates
About North Long Beach
This property is located in North Long Beach, a community in Long Beach. Explore more listings in this neighborhood to compare options and pricing.
View North Long Beach ListingsComparative Market Analysis
Affordable Tier · 5 active · 5 closed
North Long Beach · Long Beach · Single Family Residence
Listed 5.6% above the median closed sale of $720,000. Closed comps sold at 102% of list — strong seller's market.
Price Position
Positioned above the market — commands a premium.
Active Properties (5)
Active Comparables
| Address | City | Year | BD | BTH | SqFt | LotSz | LP/SqFt | LP | DIM | Score |
|---|---|---|---|---|---|---|---|---|---|---|
| 361 Harding | Long Beach | 1946 | 3 | 1 | 1,000 | 5,917 | $730 | $729,900 | 15 | 93 |
| 705 Janice | Long Beach | 1942 | 2 | 1 | 884 | 4,756 | $791 | $699,000 | 13 | 90 |
| 1219 57th | Long Beach | 1948 | 3 | 1 | 1,008 | 8,169 | $743 | $749,000 | 26 | 87 |
| 6072 Myrtle Avenue | Long Beach | 1929 | 2 | 1 | 996 | 3,713 | $718 | $714,900 | 76 | 87 |
| 6449 Lemon Avenue | Long Beach | 1947 | 2 | 1 | 1,110 | 3,944 | $622 | $690,000 | 257 | 83 |
| Total: 5 · Average | 2.4 | 1.0 | 999.6 | 5,299.8 | $720.8 | $716,560 | 77.4 | |||
| Median | 1,000 | $714,900 | ||||||||
Closed Properties (5)
Closed Comparables
| Address | City | Year | Date | BD | BTH | SqFt | LotSz | LP | SP | SP/SqFt | SP/LP | DIM | Score |
|---|---|---|---|---|---|---|---|---|---|---|---|---|---|
| 153 Cedar Turn | Long Beach | 1947 | 10/01/2026 | 2 | 1 | 1,246 | 7,129 | $785,000 | $786,000 | $631 | 1.00 | 48 | 92 |
| 360 59th | Long Beach | 1941 | 02/13/2026 | 2 | 1 | 1,014 | 6,105 | $699,900 | $720,000 | $710 | 1.03 | 36 | 90 |
| 166 Osgood Street | Long Beach | 1947 | 01/26/2026 | 2 | 1 | 763 | 5,947 | $649,900 | $675,000 | $885 | 1.04 | 48 | 89 |
| 265 Norton Street | Long Beach | 1929 | 02/18/2026 | 2 | 1 | 886 | 5,533 | $720,000 | $720,000 | $813 | 1.00 | 34 | 86 |
| 417 Adair Street | Long Beach | 1956 | 05/07/2026 | 3 | 2 | 1,007 | 2,870 | $695,000 | $715,000 | $710 | 1.03 | 41 | 84 |
| Total: 5 · Average | 2.2 | 1.2 | 983.2 | 5,516.8 | $723,200 | $723,200 | $749.8 | — | 41.4 | ||||
| Median | 1,007 | $720,000 | $720,000 | ||||||||||
Market Analysis
List vs Sale $/SqFt
Sale Price Trend
Days on Market
Sale vs List Price
This analysis was generated automatically from MLS data. For an in-depth, human-reviewed valuation, contact Joseph Sardella at josephsardella@gmail.com.