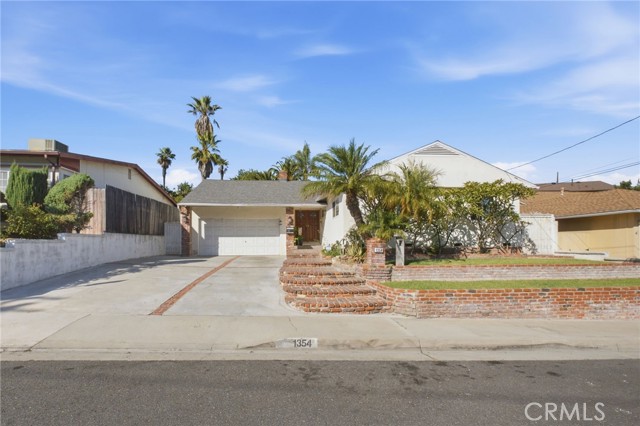
1354 Fulton, Monterey Park, CA 91755
1354 Fulton, Monterey Park, CA 91755
Property Description
Welcome to 1354 Fulton Ave, Monterey Park! Nestled in one of the area's most desirable neighborhoods and located within the highly sought-after Alhambra Unified School District, this charming home offers comfort, convenience, and an incredible lifestyle. Enjoy sunny Southern California days in your private backyard featuring a sparkling swimming pool,City light views perfect for entertaining family and friends or simply relaxing at home.Ideally situated near shopping, dining, parks, and major freeways, this home combines a prime location with everyday convenience. Whether you're looking for your first home, a place to grow, or an investment in a high-demand area, this is an opportunity you won't want to miss.
Features & Amenities
Property Details
Mortgage Calculator
Current Rates
Comparative Market Analysis
Residential Tier · 5 active · 5 closed
Monterey Park · Single Family Residence
Listed in line with the median closed sale of $1,139,800. Price per sqft ($751) is a 14% premium to closed comps ($658).
Price Position
Aligned with the market — fair pricing for the comps.
Active Properties (5)
Active Comparables
| Address | City | Year | BD | BTH | SqFt | LotSz | LP/SqFt | LP | DIM | Score |
|---|---|---|---|---|---|---|---|---|---|---|
| 1343 Garfield | Monterey Park | 1953 | 4 | 2 | 1,714 | 9,286 | $582 | $998,000 | 4 | 83 |
| 1458 Fulton | Monterey Park | 1953 | 3 | 2 | 1,379 | 8,003 | $724 | $998,900 | 31 | 80 |
| 405 Van Buren | Monterey Park | 1964 | 4 | 2 | 1,902 | 6,373 | $657 | $1.25M | 2 | 72 |
| 219 Nicholson Avenue | Monterey Park | 1936 | 3 | 2 | 1,310 | 6,773 | $824 | $1.08M | 33 | 69 |
| 938 Mira Valle | Monterey Park | 1954 | 4 | 3 | 1,170 | 9,167 | $939 | $1.10M | 73 | 68 |
| Total: 5 · Average | 3.6 | 2.2 | 1,495 | 7,920.4 | $745.2 | $1.08M | 28.6 | |||
| Median | 1,379 | $1.08M | ||||||||
Closed Properties (5)
Closed Comparables
| Address | City | Year | Date | BD | BTH | SqFt | LotSz | LP | SP | SP/SqFt | SP/LP | DIM | Score |
|---|---|---|---|---|---|---|---|---|---|---|---|---|---|
| 1690 Starbird | Monterey Park | 1955 | 02/19/2026 | 3 | 2 | 1,596 | 8,266 | $988,000 | $988,000 | $619 | 1.00 | 37 | 89 |
| 660 Bradshawe Avenue | Monterey Park | 1955 | 10/28/2026 | 4 | 3 | 1,779 | 9,834 | $1.33M | $1.27M | $713 | 0.95 | 92 | 82 |
| 1862 Hendron | Monterey Park | 1954 | 05/11/2026 | 3 | 3 | 2,368 | 7,118 | $1.29M | $1.24M | $524 | 0.96 | 180 | 78 |
| 1567 Fulton | Monterey Park | 1953 | 05/01/2026 | 3 | 2 | 1,505 | 8,454 | $1.13M | $1.14M | $757 | 1.01 | 31 | 78 |
| 290 Coral View Street | Monterey Park | 1954 | 06/16/2026 | 3 | 2 | 1,478 | 8,385 | $950,000 | $1.00M | $677 | 1.05 | 35 | 75 |
| Total: 5 · Average | 3.2 | 2.4 | 1,745.2 | 8,411.4 | $1.13M | $1.13M | $658 | — | 75 | ||||
| Median | 1,596 | $1.14M | $1.14M | ||||||||||
Market Analysis
List vs Sale $/SqFt
Sale Price Trend
Days on Market
Sale vs List Price
This analysis was generated automatically from MLS data. For an in-depth, human-reviewed valuation, contact Joseph Sardella at josephsardella@gmail.com.