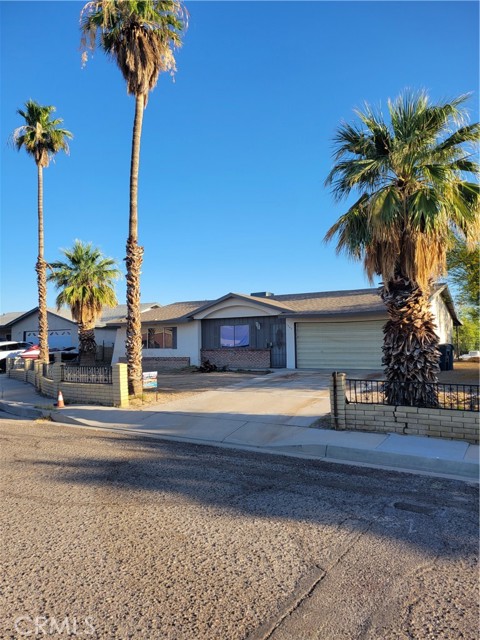
1340 Larchwood, Needles, CA 92363
1340 Larchwood, Needles, CA 92363
Property Description
This cozy single family home is located in a desirable Needles neighborhood. The surrounding homes show a pride of ownership and great curb appeal. Just completed repairs include fresh interior paint throughout, a new water heater, new plumbing fixtures in the bathrooms and kitchen. Also, lots of time and labor have been given to the exterior of the home. The patio cover / awning and facia around the house have been completely renewed with caulking and paint. The covered back patio has a large cement slab. The back yard is enclosed by a chain link fence. Enjoy a great view to the north of the mountains from the back patio!
Features & Amenities
Property Details
Mortgage Calculator
Current Rates
Comparative Market Analysis
Affordable Tier · 5 active · 5 closed
Needles · Single Family Residence
Listed 6.8% above the median closed sale of $200,000. Closed comps sold at 93% of list — buyers have negotiating leverage. Expect a longer timeline — comps averaged 237 days on market.
Price Position
Positioned above the market — commands a premium.
Active Properties (5)
Active Comparables
| Address | City | Year | BD | BTH | SqFt | LotSz | LP/SqFt | LP | DIM | Score |
|---|---|---|---|---|---|---|---|---|---|---|
| 1330 Santa Fe Circle | Needles | 1991 | 4 | 2 | 1,316 | 7,500 | $182 | $239,500 | 218 | 83 |
| 1420 Coronado | Needles | 1961 | 3 | 2 | 1,532 | 7,875 | $130 | $199,000 | 15 | 83 |
| 1417 Highland Avenue | Needles | 1939 | 3 | 2 | 1,517 | 7,500 | $162 | $245,000 | 75 | 82 |
| 1921 Flora | Needles | 1953 | 4 | 2 | 1,792 | 8,580 | $117 | $210,000 | 81 | 76 |
| 1611 Collins | Needles | 1965 | 3 | 2 | 2,172 | 16,800 | $106 | $230,000 | 108 | 74 |
| Total: 5 · Average | 3.4 | 2.0 | 1,665.8 | 9,651 | $139.4 | $224,700 | 99.4 | |||
| Median | 1,532 | $230,000 | ||||||||
Closed Properties (5)
Closed Comparables
| Address | City | Year | Date | BD | BTH | SqFt | LotSz | LP | SP | SP/SqFt | SP/LP | DIM | Score |
|---|---|---|---|---|---|---|---|---|---|---|---|---|---|
| 1359 Redwood | Needles | 1990 | 06/12/2026 | 4 | 2 | 1,522 | 7,500 | $249,700 | $235,000 | $154 | 0.94 | 219 | 88 |
| 1900 Desoto | Needles | 1966 | 05/18/2026 | 3 | 2 | 1,850 | 8,580 | $199,900 | $197,500 | $107 | 0.99 | 107 | 83 |
| 2247 Casa Loma Street | Needles | 2010 | 09/23/2026 | 3 | 2 | 2,026 | 7,504 | $250,000 | $200,000 | $99 | 0.80 | 587 | 81 |
| 610 Quivera | Needles | 1952 | 08/26/2026 | 3 | 2 | 1,168 | 6,850 | $199,000 | $185,000 | $158 | 0.93 | 146 | 75 |
| 211 Walnut Street | Needles | 1928 | 04/15/2026 | 3 | 3 | 1,700 | 12,000 | $210,000 | $205,000 | $121 | 0.98 | 127 | 72 |
| Total: 5 · Average | 3.2 | 2.2 | 1,653.2 | 8,486.8 | $204,500 | $204,500 | $127.8 | — | 237.2 | ||||
| Median | 1,700 | $200,000 | $200,000 | ||||||||||
Market Analysis
List vs Sale $/SqFt
Sale Price Trend
Days on Market
Sale vs List Price
This analysis was generated automatically from MLS data. For an in-depth, human-reviewed valuation, contact Joseph Sardella at josephsardella@gmail.com.