1 / 8
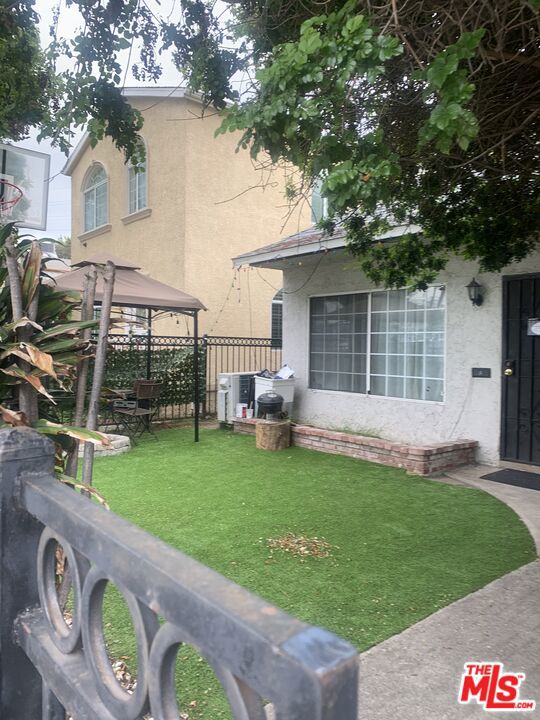
1316 North Hollywood Way, Burbank, CA 91505
$965K2bd · 2ba · 1,309 sqft
Lot 2,744 sqft•Single Family Residence•Active•1243d on market•MLS# 00-23278737
1316 North Hollywood Way, Burbank, CA 91505
MLS# 00-23278737•Residential•Single Family Residence
Active1243 days on market
$965,000
2
Beds
2
Baths
1,309
Sq Ft
2,744
Lot Sq Ft
1950
Year Built
City Lights
View
Property Description
Amazing Opportunity - Prime Location known as "The Verdugos" - Lots of Potential - 2-Units Lower Unit "A" $1,300/month Income, Upper Unit "B" $1,400/ month Income - .Zoned R$ - Presently a Duplex, but 4 Units can be Built - Sold "as-is" - Great Investment Opportunity - Upstairs Unit has a Patio - Walk to shopping & Restaurants _ Great Location.
Features & Amenities
FeeBuilt 1950
Property Details
Land Type
Fee
Year Built
1950
Property Type
Residential
Property Subtype
Single Family Residence
Heating
Wall Furnace
Cooling
Wall/Window Unit(s)
View
City Lights
Flooring
Laminate, Wood
City
Burbank
Zip Code
91505
County
Los Angeles
Mortgage Calculator
Current Rates
$
$
%
Monthly Payment
$4,879.57
Principal & Interest
Loan Amount
$772,000
Total Interest
$984,643
Total Payment Over 30 Years
$1,756,643
This calculator provides estimates only. Actual mortgage payments may include taxes, insurance, HOA fees, and PMI. Contact a lender for accurate quotes.
Comparative Market Analysis
Affordable Tier · 5 active · 5 closed
1316 North Hollywood Way, Burbank, CA 91505
Burbank · Single Family Residence
$965K
Affordable TierBeds
2
Baths
2
Sqft
1,309
Lot
2,744 sqft
Year
1950
$/Sqft
$737
Pool: No✓
Spa: No✓
View: city✓
Listed 3.0% below the median closed sale of $995,000. Price per sqft ($737) is a 18% discount to closed comps ($903).
Price Position
Aligned with the market — fair pricing for the comps.
At market
Subject listed at $965K· $737/sqft
Total list price
Closed comps
vs closed median $995K
−$30K (−3.0%)
Active comps
vs active median $995K
−$30K (−3.0%)
Price per sqft
Closed compsinsufficient comp data
Active comps
vs active avg $/sqft $867
−$130 (−15.0%)
Active Properties (5)
Active Comparables
| Address | City | Year | BD | BTH | SqFt | LotSz | LP/SqFt | LP | DIM | Score |
|---|---|---|---|---|---|---|---|---|---|---|
| 1717 Pepper | Burbank | 1948 | 2 | 2 | 1,587 | 6,481 | $629 | $999,000 | 6 | 80 |
| 1454 Clybourn Avenue | Burbank | 1960 | 3 | 2 | 1,024 | 2,972 | $977 | $999,999 | 69 | 79 |
| 1817 Rose Street | Burbank | 1939 | 3 | 2 | 1,306 | 6,000 | $688 | $899,000 | 1 | 78 |
| 1339 Kenwood | Burbank | 1946 | 2 | 1 | 884 | 5,926 | $1,103 | $975,000 | 17 | 76 |
| 5130 Auckland | Toluca Lake | 1938 | 2 | 1 | 1,058 | 5,947 | $940 | $995,000 | 19 | 72 |
| Total: 5 · Average | 2.4 | 1.6 | 1,171.8 | 5,465.2 | $867.4 | $973,599.8 | 22.4 | |||
| Median | 1,058 | $995,000 | ||||||||
Closed Properties (5)
Closed Comparables
| Address | City | Year | Date | BD | BTH | SqFt | LotSz | LP | SP | SP/SqFt | SP/LP | DIM | Score |
|---|---|---|---|---|---|---|---|---|---|---|---|---|---|
| 3300 Chandler Boulevard | Burbank | 1939 | 10/07/2026 | 4 | 2 | 1,302 | 4,451 | $1.09M | $1.09M | $841 | 1.00 | 91 | 81 |
| 1613 Pepper | Burbank | 1948 | 06/15/2026 | 3 | 2 | 1,227 | 6,504 | $995,000 | $995,000 | $811 | 1.00 | 34 | 80 |
| 1212 Avon Street | Burbank | 1948 | 07/22/2026 | 2 | 1 | 1,031 | 5,402 | $1.03M | $1.08M | $1,048 | 1.04 | 28 | 79 |
| 1335 Niagara Street | Burbank | 1939 | 06/09/2026 | 2 | 2 | 1,182 | 6,427 | $1.07M | $950,000 | $804 | 0.89 | 41 | 79 |
| 1420 Evergreen Street | Burbank | 1940 | 10/14/2026 | 2 | 2 | 950 | 6,564 | $960,000 | $960,000 | $1,011 | 1.00 | 33 | 79 |
| Total: 5 · Average | 2.6 | 1.8 | 1,138.4 | 5,869.6 | $1.02M | $1.02M | $903 | — | 45.4 | ||||
| Median | 1,182 | $995,000 | $995,000 | ||||||||||
Market Analysis
List vs Sale $/SqFt
Sale Price Trend
Days on Market
Sale vs List Price
AI-generated CMA
This analysis was generated automatically from MLS data. For an in-depth, human-reviewed valuation, contact Joseph Sardella at josephsardella@gmail.com.