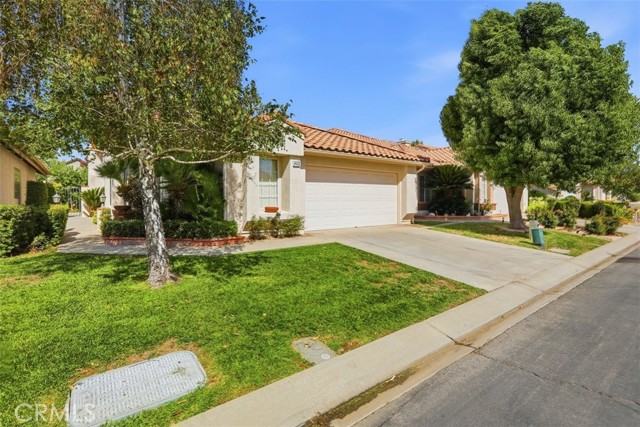
1291 Cypress Point, Banning, CA 92220
1291 Cypress Point, Banning, CA 92220
Property Description
Popular "Sun Lakes" 55+ community. This 3 bedroom 2 bath home has been completely remodeled some features include new kitchen cabinets ,quartz countertops, new stainless steel appliances, remodeled bathrooms, new vinyl flooring, new fixtures, new carpet and fresh paint. Sun lakes community features a golf course, restaurant bar/lounge,3 pools and 3 spas (one of each is indoors), tennis courts, pickleball courts, bocce ball courts and 3 clubhouses!
Features & Amenities
Property Details
Mortgage Calculator
Current Rates
Comparative Market Analysis
Affordable Tier · 5 active · 5 closed
Banning · Single Family Residence
Listed 7.8% above the median closed sale of $323,750. Expect a longer timeline — comps averaged 136 days on market.
Price Position
Positioned above the market — commands a premium.
Active Properties (5)
Active Comparables
| Address | City | Year | BD | BTH | SqFt | LotSz | LP/SqFt | LP | DIM | Score |
|---|---|---|---|---|---|---|---|---|---|---|
| 5983 Eagle Trace | Banning | 1993 | 2 | 2 | 1,254 | 4,792 | $318 | $399,000 | 14 | 92 |
| 1107 Pauma Valley | Banning | 1988 | 3 | 2 | 1,298 | 6,098 | $239 | $310,000 | 11 | 91 |
| 625 Shinecock | Banning | 1988 | 3 | 2 | 1,247 | 6,534 | $272 | $339,000 | 208 | 90 |
| 1359 Pauma Valley | Banning | 1993 | 2 | 2 | 1,472 | 3,485 | $244 | $359,900 | 87 | 85 |
| 680 Indian Wells Road | Banning | 1987 | 3 | 2 | 1,505 | 4,792 | $249 | $375,000 | 107 | 85 |
| Total: 5 · Average | 2.6 | 2.0 | 1,355.2 | 5,140.2 | $264.4 | $356,580 | 85.4 | |||
| Median | 1,298 | $359,900 | ||||||||
Closed Properties (5)
Closed Comparables
| Address | City | Year | Date | BD | BTH | SqFt | LotSz | LP | SP | SP/SqFt | SP/LP | DIM | Score |
|---|---|---|---|---|---|---|---|---|---|---|---|---|---|
| 6351 Spyglass | Banning | 1989 | 06/24/2026 | 3 | 2 | 1,195 | 4,792 | $307,000 | $307,000 | $257 | 1.00 | 261 | 92 |
| 909 Pauma Valley | Banning | 1988 | 10/23/2026 | 3 | 2 | 1,161 | 4,792 | $315,000 | $323,750 | $279 | 1.03 | 124 | 92 |
| 832 Pine Valley | Banning | 1989 | 09/10/2026 | 3 | 2 | 1,195 | 3,920 | $349,500 | $333,000 | $279 | 0.95 | 37 | 92 |
| 6340 Colonial | Banning | 1989 | 07/06/2026 | 2 | 2 | 1,195 | 4,356 | $330,000 | $320,000 | $268 | 0.97 | 62 | 91 |
| 6353 Colonial | Banning | 1989 | 10/27/2026 | 2 | 2 | 1,289 | 4,356 | $329,800 | $326,800 | $254 | 0.99 | 195 | 91 |
| Total: 5 · Average | 2.6 | 2.0 | 1,207 | 4,443.2 | $322,110 | $322,110 | $267.4 | — | 135.8 | ||||
| Median | 1,195 | $323,750 | $323,750 | ||||||||||
Market Analysis
List vs Sale $/SqFt
Sale Price Trend
Days on Market
Sale vs List Price
This analysis was generated automatically from MLS data. For an in-depth, human-reviewed valuation, contact Joseph Sardella at josephsardella@gmail.com.