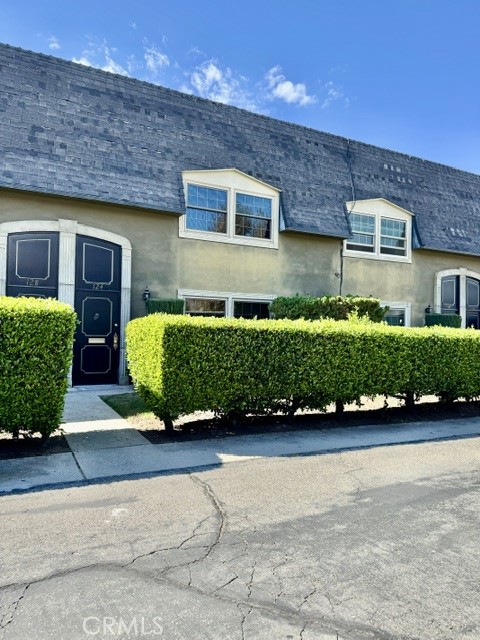
124 Carrie Lane, Redlands, CA 92373
124 Carrie Lane, Redlands, CA 92373
Property Description
Welcome to this beautifully refreshed home in the desirable South Redlands area, offering a convenient location close to downtown Redlands, shopping, dining, and everyday amenities. The home features fresh interior paint, new windows, new carpeting, and new laminate flooring, creating a clean, modern, and inviting atmosphere. The remodeled kitchen boasts new countertops, cabinets, a sink, faucet, garbage disposal, stove, microwave, and stylish new light fixtures. These thoughtful updates give the kitchen a fresh, contemporary look while providing a functional space for everyday cooking and entertaining. With its numerous recent upgrades and convenient location in South Redlands, this home is a wonderful opportunity for buyers seeking comfort, style, and accessibility. Don't miss the opportunity to make this beautifully updated home your own!
Features & Amenities
Property Details
Mortgage Calculator
Current Rates
Comparative Market Analysis
Affordable Tier · 5 active · 5 closed
Redlands · Condominium
Listed 13.1% above the median closed sale of $380,000.
Price Position
Positioned above the market — commands a premium.
Active Properties (5)
Active Comparables
| Address | City | Year | BD | BTH | SqFt | LotSz | LP/SqFt | LP | DIM | Score |
|---|---|---|---|---|---|---|---|---|---|---|
| 139 Cypress | Redlands | 1965 | 3 | 3 | 1,683 | 1,683 | $235 | $395,000 | 113 | 95 |
| 242 Fern Avenue | Redlands | 1980 | 2 | 2 | 1,188 | 1,200 | $336 | $399,000 | 10 | 83 |
| 122 Tamarisk | Redlands | 1979 | 3 | 3 | 1,392 | 1,392 | $348 | $484,999 | 66 | 81 |
| 91 Tennessee Street | Redlands | 1982 | 2 | 3 | 1,548 | 1,800 | $255 | $395,000 | 51 | 76 |
| 633 Church Pl | Redlands | 1986 | 3 | 3 | 1,268 | 1,268 | $315 | $399,000 | 45 | 74 |
| Total: 5 · Average | 2.6 | 2.8 | 1,415.8 | 1,468.6 | $297.8 | $414,599.8 | 57 | |||
| Median | 1,392 | $399,000 | ||||||||
Closed Properties (5)
Closed Comparables
| Address | City | Year | Date | BD | BTH | SqFt | LotSz | LP | SP | SP/SqFt | SP/LP | DIM | Score |
|---|---|---|---|---|---|---|---|---|---|---|---|---|---|
| 135 Cypress Avenue | Redlands | 1965 | 04/17/2026 | 3 | 3 | 1,543 | 1,543 | $365,000 | $369,800 | $240 | 1.01 | 49 | 91 |
| 246 Fern Avenue | Redlands | 1980 | 04/17/2026 | 3 | 2 | 1,486 | 1,500 | $435,000 | $420,000 | $283 | 0.97 | 65 | 85 |
| 923 State | Redlands | 1979 | 09/10/2026 | 3 | 3 | 1,392 | 1,392 | $479,000 | $470,000 | $338 | 0.98 | 92 | 81 |
| 254 Fern | Redlands | 1980 | 07/28/2026 | 2 | 2 | 1,188 | 1,200 | $399,000 | $380,000 | $320 | 0.95 | 186 | 78 |
| 238 Fern Avenue | Redlands | 1980 | 11/10/2025 | 2 | 2 | 1,188 | 1,200 | $375,000 | $370,000 | $311 | 0.99 | 107 | 74 |
| Total: 5 · Average | 2.6 | 2.4 | 1,359.4 | 1,367 | $401,960 | $401,960 | $298.4 | — | 99.8 | ||||
| Median | 1,392 | $380,000 | $380,000 | ||||||||||
Market Analysis
List vs Sale $/SqFt
Sale Price Trend
Days on Market
Sale vs List Price
This analysis was generated automatically from MLS data. For an in-depth, human-reviewed valuation, contact Joseph Sardella at josephsardella@gmail.com.