1 / 7
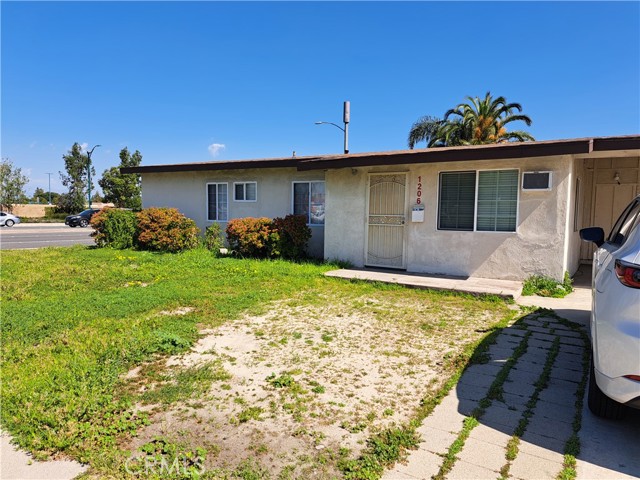
1206 South Palm, Anaheim, CA 92805
$818K4bd · 2ba · 1,106 sqft
Lot 7,243 sqft•Single Family Residence•Active•73d on market•MLS# SW-26183716
1206 South Palm, Anaheim, CA 92805
MLS# SW-26183716•Residential•Single Family Residence
Active73 days on market
$818,000
4
Beds
2
Baths
1,106
Sq Ft
7,243
Lot Sq Ft
1955
Year Built
None
View
Property Description
Property sold as-is. Good location, within walking distance to major entertainment and dining. 2 street accesses to property, one on palm Street, the other on ball rd.
Features & Amenities
FeeBuilt 1955
Property Details
Land Type
Fee
Year Built
1955
Property Type
Residential
Property Subtype
Single Family Residence
Parking Spaces
2
Garage Spaces
2
Cooling
Wall/Window Unit(s)
View
None
City
Anaheim
Zip Code
92805
County
Orange
Mortgage Calculator
Current Rates
$
$
%
Monthly Payment
$4,136.25
Principal & Interest
Loan Amount
$654,400
Total Interest
$834,651
Total Payment Over 30 Years
$1,489,051
This calculator provides estimates only. Actual mortgage payments may include taxes, insurance, HOA fees, and PMI. Contact a lender for accurate quotes.
Comparative Market Analysis
Affordable Tier · 5 active · 5 closed
1206 South Palm, Anaheim, CA 92805
Anaheim · Single Family Residence
$818K
Affordable TierBeds
4
Baths
2
Sqft
1,106
Lot
7,243 sqft
Year
1955
$/Sqft
$740
Pool: No✓
View: None✓
Garage: 2-car✓
Listed 6.0% below the median closed sale of $870,000. Closed comps sold at 100% of list — strong seller's market.
Price Position
Priced below the market — value advantage over the field.
Price advantage
Subject listed at $818K· $740/sqft
Total list price
Closed comps
vs closed median $870K
−$52K (−6.0%)
Active comps
vs active median $850K
−$32K (−3.8%)
Price per sqft
Closed compsinsufficient comp data
Active comps
vs active avg $/sqft $739
+$1 (+0.1%)
Active Properties (5)
Active Comparables
| Address | City | Year | BD | BTH | SqFt | LotSz | LP/SqFt | LP | DIM | Score |
|---|---|---|---|---|---|---|---|---|---|---|
| 628 Helena Street | Anaheim | 1949 | 2 | 2 | 888 | 5,269 | $873 | $775,000 | 45 | 80 |
| 726 Emily Street | Anaheim | 1940 | 2 | 1 | 1,131 | 5,450 | $752 | $850,000 | 66 | 79 |
| 413 FALCON Street | Anaheim | 1956 | 3 | 2 | 1,278 | 7,920 | $692 | $885,000 | 60 | 78 |
| 874 Claudina | Anaheim | 1955 | 2 | 1 | 889 | 3,584 | $786 | $699,000 | 8 | 77 |
| 837 Reseda Street | Anaheim | 1955 | 3 | 2 | 1,445 | 6,000 | $594 | $859,000 | 40 | 75 |
| Total: 5 · Average | 2.4 | 1.6 | 1,126.2 | 5,644.6 | $739.4 | $813,600 | 43.8 | |||
| Median | 1,131 | $850,000 | ||||||||
Closed Properties (5)
Closed Comparables
| Address | City | Year | Date | BD | BTH | SqFt | LotSz | LP | SP | SP/SqFt | SP/LP | DIM | Score |
|---|---|---|---|---|---|---|---|---|---|---|---|---|---|
| 719 Citron Street | Anaheim | 1950 | 03/02/2026 | 3 | 1 | 1,101 | 6,179 | $735,000 | $735,000 | $668 | 1.00 | 0 | 82 |
| 1125 Hampshire | Anaheim | 1958 | 02/11/2026 | 3 | 2 | 1,141 | 6,900 | $874,888 | $920,000 | $806 | 1.05 | 37 | 82 |
| 526 Water Street | Anaheim | 1950 | 01/29/2026 | 3 | 1 | 1,106 | 5,995 | $810,000 | $775,000 | $701 | 0.96 | 127 | 81 |
| 616 Boxwood Street | Anaheim | 1953 | 02/03/2026 | 4 | 2 | 1,219 | 6,542 | $889,900 | $880,000 | $722 | 0.99 | 175 | 79 |
| 600 Emily | Anaheim | 1923 | 05/18/2026 | 3 | 2 | 1,087 | 5,014 | $859,000 | $870,000 | $800 | 1.01 | 42 | 78 |
| Total: 5 · Average | 3.2 | 1.6 | 1,130.8 | 6,126 | $836,000 | $836,000 | $739.4 | — | 76.2 | ||||
| Median | 1,106 | $870,000 | $870,000 | ||||||||||
Market Analysis
List vs Sale $/SqFt
Sale Price Trend
Days on Market
Sale vs List Price
AI-generated CMA
This analysis was generated automatically from MLS data. For an in-depth, human-reviewed valuation, contact Joseph Sardella at josephsardella@gmail.com.