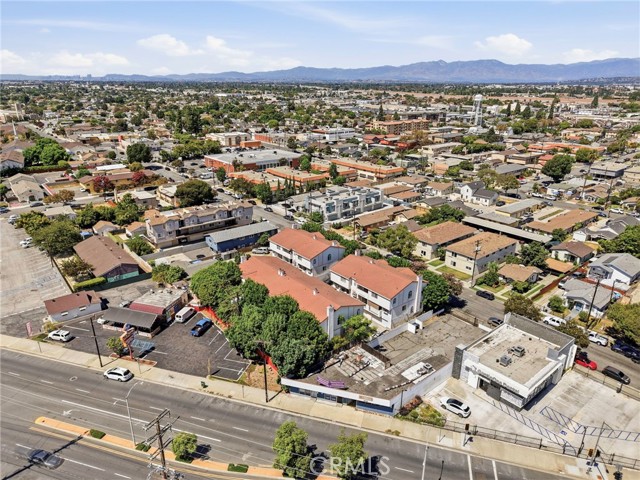
12042 Orange, Norwalk, CA 90650
12042 Orange, Norwalk, CA 90650
Property Description
Welcome to this beautifully maintained 3-bedroom, 3-bathroom townhouse in Norwalk, CA, offering approximately 1,624 sq. ft. of comfortable living space. This home has been very well cared for and features updated flooring, fresh and well-maintained interior paint, and a beautifully remodeled bathroom. The spacious layout offers plenty of room for everyday living and entertaining, while the pride of ownership is evident throughout. Move-in ready and full of potential, this charming townhouse is ready for its next owners to make it home.
Features & Amenities
Property Details
Mortgage Calculator
Current Rates
Comparative Market Analysis
Residential Tier · 5 active · 5 closed
Norwalk · Townhouse
Listed in line with the median closed sale of $640,000. Price per sqft ($400) is a 15% discount to closed comps ($468). Closed comps sold at 102% of list — strong seller's market.
Price Position
Aligned with the market — fair pricing for the comps.
Active Properties (5)
Active Comparables
| Address | City | Year | BD | BTH | SqFt | LotSz | LP/SqFt | LP | DIM | Score |
|---|---|---|---|---|---|---|---|---|---|---|
| 12032 Orange Street | Norwalk | 1995 | 3 | 3 | 1,624 | 22,204 | $376 | $610,000 | 39 | 93 |
| 12046 Olive Street | Norwalk | 2021 | 3 | 4 | 1,880 | 38,403 | $372 | $699,000 | 24 | 77 |
| 15539 Woodruff | Bellflower | 1991 | 3 | 3 | 1,366 | 35,809 | $472 | $645,000 | 42 | 68 |
| 12927 Lariat Lane | Norwalk | 1964 | 3 | 2 | 1,237 | 4,291 | $477 | $590,000 | 39 | 61 |
| 10409 Snowbell Court | Santa Fe Springs | 2013 | 3 | 3 | 1,400 | 104,233 | $492 | $689,000 | 2 | 60 |
| Total: 5 · Average | 3.0 | 3.0 | 1,501.4 | 40,988 | $437.8 | $646,600 | 29.2 | |||
| Median | 1,400 | $645,000 | ||||||||
Closed Properties (5)
Closed Comparables
| Address | City | Year | Date | BD | BTH | SqFt | LotSz | LP | SP | SP/SqFt | SP/LP | DIM | Score |
|---|---|---|---|---|---|---|---|---|---|---|---|---|---|
| 12038 Orange | Norwalk | 1995 | 02/04/2026 | 3 | 3 | 1,624 | 22,204 | $650,000 | $640,000 | $394 | 0.98 | 20 | 95 |
| 12021 Walnut Street | Norwalk | 1984 | 05/29/2026 | 2 | 2 | 1,143 | 18,842 | $615,000 | $615,000 | $538 | 1.00 | 47 | 82 |
| 11945 Olive Street | Norwalk | 2005 | 07/27/2026 | 3 | 2 | 1,410 | 13,251 | $635,000 | $655,000 | $465 | 1.03 | 60 | 81 |
| 12235 Pine | Norwalk | 1988 | 07/30/2026 | 3 | 3 | 1,206 | 64,745 | $580,000 | $580,400 | $481 | 1.00 | 35 | 78 |
| 13144 Sycamore Village Drive | Norwalk | 1995 | 04/17/2026 | 3 | 3 | 1,491 | 90,627 | $649,999 | $690,000 | $463 | 1.06 | 36 | 78 |
| Total: 5 · Average | 2.8 | 2.6 | 1,374.8 | 41,933.8 | $636,080 | $636,080 | $468.2 | — | 39.6 | ||||
| Median | 1,410 | $640,000 | $640,000 | ||||||||||
Market Analysis
List vs Sale $/SqFt
Sale Price Trend
Days on Market
Sale vs List Price
This analysis was generated automatically from MLS data. For an in-depth, human-reviewed valuation, contact Joseph Sardella at josephsardella@gmail.com.