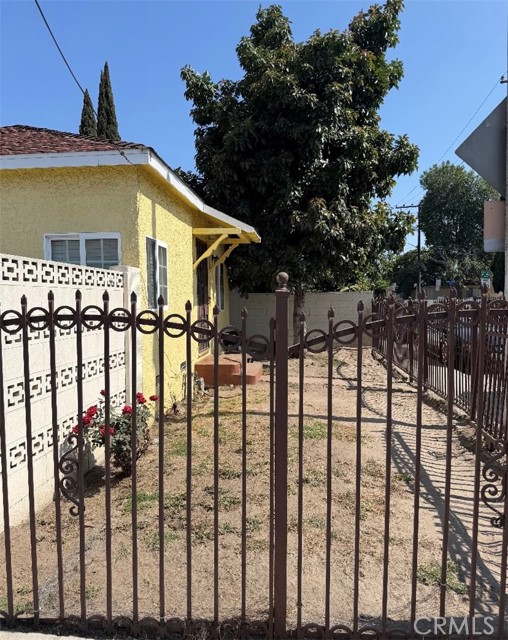
11415 California, Lynwood, CA 90262
11415 California, Lynwood, CA 90262
Property Description
Great Duplex right in the Heart of the City of Lynwood! close to Plaza Mexico and a block from freeway,This Boasts of 2 separate Units 1 bedroom each very roomy living rooms , Kitchen with dining area and Laundry room with hookups, long Driveway with plenty of parking and a 2 car Garage that would Make a GREAT ADU , City of Lynwood program provides approved plans ,Plenty of space to Grow !
Features & Amenities
Property Details
Mortgage Calculator
Current Rates
Comparative Market Analysis
Affordable Tier · 1 active · 5 closed
Lynwood · Duplex
Listed 6.1% above the median closed sale of $655,000. Closed comps sold at 106% of list — strong seller's market. Expect a longer timeline — comps averaged 120 days on market.
Price Position
Positioned above the market — commands a premium.
Active Properties (1)
Active Comparables
| Address | City | Year | BD | BTH | SqFt | LotSz | LP/SqFt | LP | DIM | Score |
|---|---|---|---|---|---|---|---|---|---|---|
| 811 East 113th Street | Los Angeles | 1926 | 3 | 2 | 1,550 | 5,598 | $384 | $595,000 | 58 | 60 |
| Total: 1 · Average | 3.0 | 2.0 | 1,550 | 5,598 | $384 | $595,000 | 58 | |||
| Median | 1,550 | $595,000 | ||||||||
Closed Properties (5)
Closed Comparables
| Address | City | Year | Date | BD | BTH | SqFt | LotSz | LP | SP | SP/SqFt | SP/LP | DIM | Score |
|---|---|---|---|---|---|---|---|---|---|---|---|---|---|
| 11641 State | Lynwood | 1953 | 10/27/2026 | 2 | 1 | 1,174 | 6,112 | $700,000 | $745,000 | $635 | 1.06 | 53 | 85 |
| 13127 Penrose | Compton | 1938 | 07/24/2026 | 3 | 2 | 1,288 | 7,273 | $650,000 | $655,000 | $509 | 1.01 | 75 | 77 |
| 1616 Willowbrook | Compton | 1950 | 07/31/2026 | 3 | 2 | 1,546 | 7,514 | $625,000 | $645,000 | $417 | 1.03 | 50 | 69 |
| 522 Cherry Street | Compton | 1957 | 05/27/2026 | 2 | 2 | 960 | 4,996 | $530,000 | $603,000 | $628 | 1.14 | 326 | 68 |
| 524 Almond Street | Compton | 1945 | 06/18/2026 | 4 | 2 | 1,606 | 6,246 | $660,000 | $685,000 | $427 | 1.04 | 96 | 62 |
| Total: 5 · Average | 2.8 | 1.8 | 1,314.8 | 6,428.2 | $666,600 | $666,600 | $523.2 | — | 120 | ||||
| Median | 1,288 | $655,000 | $655,000 | ||||||||||
Market Analysis
List vs Sale $/SqFt
Sale Price Trend
Days on Market
Sale vs List Price
This analysis was generated automatically from MLS data. For an in-depth, human-reviewed valuation, contact Joseph Sardella at josephsardella@gmail.com.