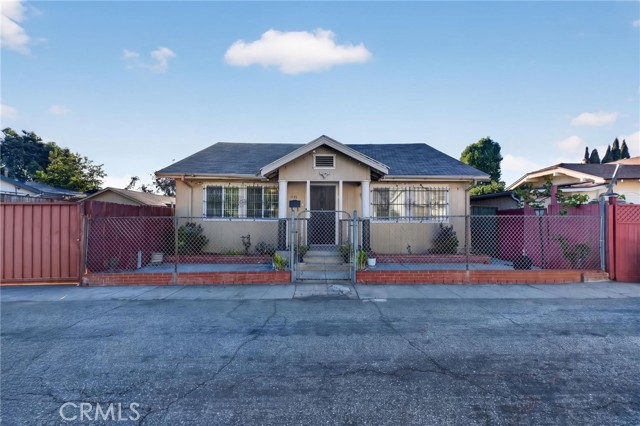
1135 Larch, Inglewood, CA 90301
1135 Larch, Inglewood, CA 90301
Property Description
Located on a private street, this unique single-family property is more than meets the eye, offering a flexible layout with additional spaces created beyond the original configuration. The property features a garage conversion, attic space with two additional rooms and bathroom, a prep kitchen, and a small side room on the first floor. The first level primary bathroom has been remodeled and the interior house has been freshly painted. Spacious side area opens to the private front alley via a rolling gate and has ample space to park multiple vehicles. With its expanded layout, additional spaces, and generous parking area, this property offers a range of possibilities for buyers seeking flexibility and additional usable space. Convenient location near Intuit Dome, SoFi Stadium and LAX. Buyers are encouraged to independently verify permits, square footage, room count, intended uses, and applicable building requirements.
Features & Amenities
Property Details
Mortgage Calculator
Current Rates
Comparative Market Analysis
Affordable Tier · 5 active · 5 closed
Inglewood · Single Family Residence
Listed 6.2% below the median closed sale of $725,000. Price per sqft ($572) is a 18% discount to closed comps ($694).
Price Position
Priced below the market — value advantage over the field.
Active Properties (5)
Active Comparables
| Address | City | Year | BD | BTH | SqFt | LotSz | LP/SqFt | LP | DIM | Score |
|---|---|---|---|---|---|---|---|---|---|---|
| 439 98th | Inglewood | 1926 | 2 | 1 | 572 | 2,362 | $1,031 | $589,995 | 7 | 83 |
| 4134 107th | Inglewood | 1925 | 3 | 2 | 1,143 | 4,166 | $661 | $755,000 | 66 | 81 |
| 3735 117th | Hawthorne | 1940 | 3 | 1 | 1,157 | 7,572 | $605 | $699,999 | 6 | 73 |
| 5018 111th Place | Inglewood | 1912 | 3 | 2 | 1,368 | 5,178 | $439 | $600,000 | 20 | 72 |
| 12247 Cedar Avenue | Hawthorne | 1951 | 2 | 1 | 842 | 3,191 | $890 | $749,000 | 5 | 67 |
| Total: 5 · Average | 2.6 | 1.4 | 1,016.4 | 4,493.8 | $725.2 | $678,798.8 | 20.8 | |||
| Median | 1,143 | $699,999 | ||||||||
Closed Properties (5)
Closed Comparables
| Address | City | Year | Date | BD | BTH | SqFt | LotSz | LP | SP | SP/SqFt | SP/LP | DIM | Score |
|---|---|---|---|---|---|---|---|---|---|---|---|---|---|
| 115 Hardy | Inglewood | 1925 | 10/09/2026 | 2 | 1 | 748 | 3,060 | $620,000 | $635,000 | $849 | 1.02 | 30 | 85 |
| 400 Buckthorn Street | Inglewood | 1926 | 04/27/2026 | 2 | 1 | 908 | 3,625 | $675,000 | $665,000 | $732 | 0.98 | 121 | 85 |
| 4323 105th Street | Inglewood | 1930 | 05/20/2026 | 2 | 2 | 1,148 | 5,722 | $699,999 | $725,000 | $632 | 1.04 | 161 | 85 |
| 920 Osage Avenue | Inglewood | 1924 | 08/07/2026 | 3 | 1 | 973 | 3,760 | $749,999 | $760,000 | $781 | 1.01 | 66 | 83 |
| 205 Hardy Street | Inglewood | 1927 | 09/24/2026 | 2 | 2 | 1,539 | 5,146 | $799,900 | $730,000 | $474 | 0.91 | 103 | 79 |
| Total: 5 · Average | 2.2 | 1.4 | 1,063.2 | 4,262.6 | $703,000 | $703,000 | $693.6 | — | 96.2 | ||||
| Median | 973 | $725,000 | $725,000 | ||||||||||
Market Analysis
List vs Sale $/SqFt
Sale Price Trend
Days on Market
Sale vs List Price
This analysis was generated automatically from MLS data. For an in-depth, human-reviewed valuation, contact Joseph Sardella at josephsardella@gmail.com.