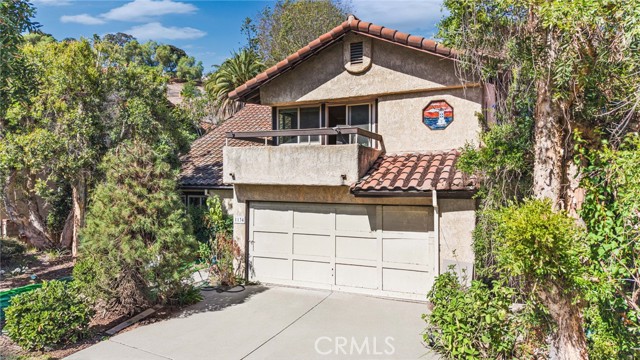
1134 Goldenrose Street, San Pedro, CA 90731
1134 Goldenrose Street, San Pedro, CA 90731
Property Description
Welcome to 1134 Golden Rose St in San Pedro! Situated on a quiet cul-de-sac, this property offers a great opportunity for buyers seeking a home with a large lot and plenty of potential. This cosmetic fixer-upper needs work and is ready for your personal touch, making it an excellent opportunity for investors, contractors, or buyers looking to renovate and customize a home to their taste. With a spacious lot and a desirable location near major freeways, shopping, dining, schools, and local amenities, the possibilities are worth exploring. Bring your vision and creativity to make this property your own!
Features & Amenities
Property Details
Mortgage Calculator
Current Rates
Comparative Market Analysis
Residential Tier · 5 active · 5 closed
San Pedro · Single Family Residence
Listed 13.0% above the median closed sale of $929,000. Price per sqft ($470) is a 16% discount to closed comps ($559). Closed comps sold at 100% of list — strong seller's market.
Price Position
Positioned above the market — commands a premium.
Active Properties (5)
Active Comparables
| Address | City | Year | BD | BTH | SqFt | LotSz | LP/SqFt | LP | DIM | Score |
|---|---|---|---|---|---|---|---|---|---|---|
| 1311 Meyler | San Pedro | 1963 | 4 | 2 | 1,796 | 10,190 | $618 | $1.11M | 55 | 84 |
| 211 Western Avenue | San Pedro | 1953 | 4 | 3 | 1,635 | 7,694 | $660 | $1.08M | 19 | 79 |
| 954 6th Street | San Pedro | 1976 | 3 | 3 | 1,862 | 3,382 | $591 | $1.10M | 108 | 73 |
| 221 Harbor View | San Pedro | 1942 | 3 | 2 | 1,277 | 5,451 | $744 | $950,000 | 262 | 70 |
| 153 Hanford Avenue | San Pedro | 1939 | 3 | 2 | 1,592 | 5,847 | $565 | $899,990 | 254 | 68 |
| Total: 5 · Average | 3.4 | 2.4 | 1,632.4 | 6,512.8 | $635.6 | $1.03M | 139.6 | |||
| Median | 1,635 | $1.08M | ||||||||
Closed Properties (5)
Closed Comparables
| Address | City | Year | Date | BD | BTH | SqFt | LotSz | LP | SP | SP/SqFt | SP/LP | DIM | Score |
|---|---|---|---|---|---|---|---|---|---|---|---|---|---|
| 1129 W Capitol Dr. | San Pedro | 1995 | 06/12/2026 | 4 | 3 | 2,013 | 109,722 | $949,000 | $965,000 | $479 | 1.02 | 25 | 78 |
| 783 Gatun | San Pedro | 2016 | 07/17/2026 | 3 | 3 | 2,046 | 20,633 | $939,000 | $939,000 | $459 | 1.00 | 37 | 77 |
| 783 Gatun Street | San Pedro | 2016 | 06/03/2026 | 3 | 3 | 1,938 | 20,633 | $929,000 | $929,000 | $479 | 1.00 | 63 | 75 |
| 1073 Upland Avenue | San Pedro | 1939 | 08/14/2026 | 4 | 2 | 1,455 | 4,801 | $900,000 | $900,000 | $619 | 1.00 | 63 | 74 |
| 1236 Elberon Avenue | San Pedro | 1941 | 06/04/2026 | 3 | 2 | 1,207 | 4,803 | $925,000 | $915,000 | $758 | 0.99 | 28 | 73 |
| Total: 5 · Average | 3.4 | 2.6 | 1,731.8 | 32,118.4 | $929,600 | $929,600 | $558.8 | — | 43.2 | ||||
| Median | 1,938 | $929,000 | $929,000 | ||||||||||
Market Analysis
List vs Sale $/SqFt
Sale Price Trend
Days on Market
Sale vs List Price
This analysis was generated automatically from MLS data. For an in-depth, human-reviewed valuation, contact Joseph Sardella at josephsardella@gmail.com.