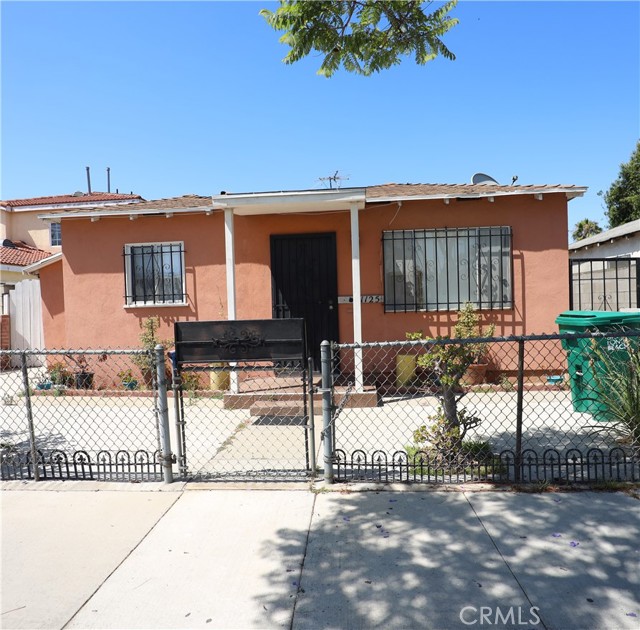
1125 East Salt Lake Street, Long Beach, CA 90806
1125 East Salt Lake Street, Long Beach, CA 90806
Property Description
One Story Single Family Residence. 2 Bedrooms, 1 Bath and 2 car detached garage with driveway. Need some works/repairs. "AS IS" Sale. Lots of Potential for Improvements. Zone LBR2N, Buyer to verify including the Square Footage, Permits, etc. Please do not disturb occupant. Shown by confirmed appointment only. Submit all offers.
Features & Amenities
Property Details
Mortgage Calculator
Current Rates
About Poly High
This property is located in Poly High, a community in Long Beach. Explore more listings in this neighborhood to compare options and pricing.
View Poly High ListingsComparative Market Analysis
Affordable Tier · 5 active · 5 closed
Poly High · Long Beach · Single Family Residence
Listed 8.6% below the median closed sale of $640,000. Price per sqft ($688) is a 29% premium to closed comps ($534). Closed comps sold at 103% of list — strong seller's market.
Price Position
Priced below the market — value advantage over the field.
Active Properties (5)
Active Comparables
| Address | City | Year | BD | BTH | SqFt | LotSz | LP/SqFt | LP | DIM | Score |
|---|---|---|---|---|---|---|---|---|---|---|
| 400 21st | Long Beach | 1923 | 3 | 1 | 887 | 2,298 | $676 | $599,450 | 81 | 81 |
| 1045 New York | Long Beach | 1922 | 1 | 1 | 649 | 1,856 | $847 | $550,000 | 65 | 75 |
| 937 Martin Luther King Jr. Ave | Long Beach | 1980 | 2 | 1 | 903 | 2,932 | $663 | $599,000 | 15 | 68 |
| 2412 Gale Avenue | Long Beach | 1924 | 2 | 1 | 781 | 2,622 | $832 | $650,000 | 25 | 67 |
| 730 9th | Pomona | 1908 | 2 | 1 | 1,140 | 5,977 | $504 | $575,000 | 25 | 64 |
| Total: 5 · Average | 2.0 | 1.0 | 872 | 3,137 | $704.4 | $594,690 | 42.2 | |||
| Median | 887 | $599,000 | ||||||||
Closed Properties (5)
Closed Comparables
| Address | City | Year | Date | BD | BTH | SqFt | LotSz | LP | SP | SP/SqFt | SP/LP | DIM | Score |
|---|---|---|---|---|---|---|---|---|---|---|---|---|---|
| 2173 Olive | Long Beach | 1919 | 06/10/2026 | 3 | 1 | 1,084 | 5,251 | $549,900 | $565,000 | $521 | 1.03 | 73 | 81 |
| 2064 Myrtle | Long Beach | 1921 | 05/07/2026 | 2 | 1 | 1,112 | 6,764 | $600,000 | $600,000 | $540 | 1.00 | 38 | 78 |
| 1154 20th | Long Beach | 1920 | 05/14/2026 | 2 | 1 | 1,048 | 5,163 | $609,999 | $650,000 | $620 | 1.07 | 38 | 73 |
| 1204 Smith | Long Beach | 1922 | 07/01/2026 | 3 | 2 | 1,146 | 2,299 | $649,950 | $655,000 | $572 | 1.01 | 63 | 73 |
| 2148 Myrtle | Long Beach | 1911 | 09/02/2026 | 3 | 2 | 1,544 | 6,688 | $600,000 | $640,000 | $415 | 1.07 | 47 | 67 |
| Total: 5 · Average | 2.6 | 1.4 | 1,186.8 | 5,233 | $622,000 | $622,000 | $533.6 | — | 51.8 | ||||
| Median | 1,112 | $640,000 | $640,000 | ||||||||||
Market Analysis
List vs Sale $/SqFt
Sale Price Trend
Days on Market
Sale vs List Price
This analysis was generated automatically from MLS data. For an in-depth, human-reviewed valuation, contact Joseph Sardella at josephsardella@gmail.com.