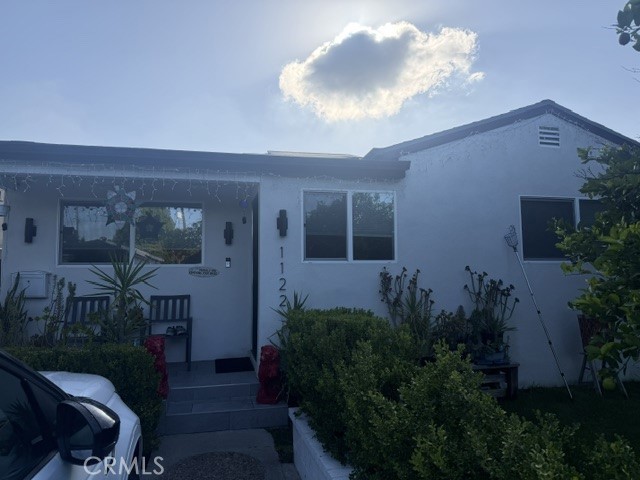
1122 North Beachwood, Burbank, CA 91506
1122 North Beachwood, Burbank, CA 91506
Property Description
A Newer Upgraded Home - Fantastic home and Location Wonderful Curve Appeal , Situated in desirable Burbank Area Close to all shopping and Freeway Aces . updated Property, Roof Aircon Exterior interior tons of upgrade , move in Ready, Great set up For future ADU .Swimming pool . A must see property
Features & Amenities
Property Details
Mortgage Calculator
Current Rates
Comparative Market Analysis
Affordable Tier · 5 active · 5 closed
Burbank · Single Family Residence
Listed in line with the median closed sale of $1,300,000. Price per sqft ($1,255) is a 25% premium to closed comps ($1,002). Closed comps sold at 109% of list — strong seller's market.
Price Position
Aligned with the market — fair pricing for the comps.
Active Properties (5)
Active Comparables
| Address | City | Year | BD | BTH | SqFt | LotSz | LP/SqFt | LP | DIM | Score |
|---|---|---|---|---|---|---|---|---|---|---|
| 1245 Orchard Drive | Burbank | 1928 | 2 | 2 | 963 | 6,752 | $1,506 | $1.45M | 30 | 82 |
| 400 University Avenue | Burbank | 1950 | 3 | 2 | 1,489 | 6,960 | $823 | $1.23M | 80 | 68 |
| 217 Griffith Park Drive | Burbank | 1943 | 3 | 2 | 1,780 | 6,848 | $786 | $1.40M | 5 | 67 |
| 1221 Frederic Street | Burbank | 1939 | 3 | 2 | 1,900 | 7,875 | $684 | $1.30M | 33 | 65 |
| 414 University Avenue | Burbank | 1949 | 4 | 2 | 1,824 | 7,008 | $712 | $1.30M | 57 | 62 |
| Total: 5 · Average | 3.0 | 2.0 | 1,591.2 | 7,088.6 | $902.2 | $1.33M | 41 | |||
| Median | 1,780 | $1.30M | ||||||||
Closed Properties (5)
Closed Comparables
| Address | City | Year | Date | BD | BTH | SqFt | LotSz | LP | SP | SP/SqFt | SP/LP | DIM | Score |
|---|---|---|---|---|---|---|---|---|---|---|---|---|---|
| 702 Reese Place | Burbank | 1942 | 04/24/2026 | 2 | 1 | 1,020 | 6,741 | $999,999 | $1.23M | $1,201 | 1.23 | 52 | 83 |
| 900 Parish | Burbank | 1938 | 04/22/2026 | 4 | 2 | 1,190 | 5,861 | $1.25M | $1.21M | $1,017 | 0.97 | 99 | 83 |
| 930 Keystone Street | Burbank | 1947 | 11/24/2025 | 3 | 2 | 1,260 | 5,839 | $999,000 | $1.30M | $1,032 | 1.30 | 42 | 76 |
| 437 Parish Pl. | Burbank | 1951 | 04/15/2026 | 3 | 2 | 1,480 | 5,101 | $1.43M | $1.39M | $939 | 0.97 | 57 | 72 |
| 743 Sparks St | Burbank | 1952 | 10/19/2026 | 3 | 2 | 1,658 | 5,831 | $1.38M | $1.36M | $820 | 0.99 | 73 | 70 |
| Total: 5 · Average | 3.0 | 1.8 | 1,321.6 | 5,874.6 | $1.30M | $1.30M | $1,001.8 | — | 64.6 | ||||
| Median | 1,260 | $1.30M | $1.30M | ||||||||||
Market Analysis
List vs Sale $/SqFt
Sale Price Trend
Days on Market
Sale vs List Price
This analysis was generated automatically from MLS data. For an in-depth, human-reviewed valuation, contact Joseph Sardella at josephsardella@gmail.com.