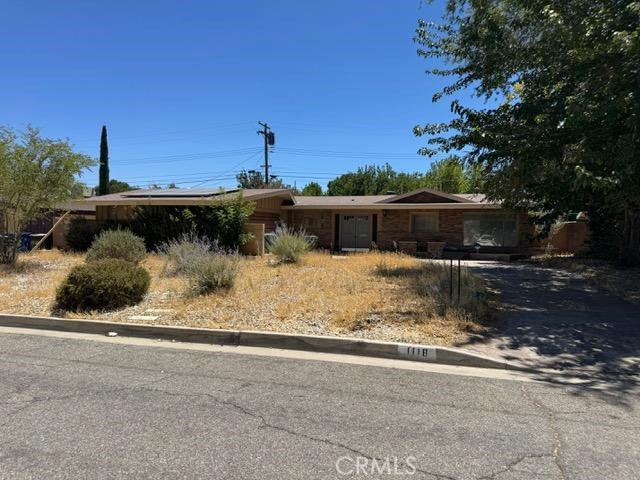
1118 East Avenue J3, Lancaster, CA 93535
1118 East Avenue J3, Lancaster, CA 93535
Property Description
Great opportunity for investors, flippers, or buyers looking for a project. This Lancaster property is a true fixer with plenty of potential for renovation and value-add improvements. Set on a spacious lot, the home offers a versatile layout ready to be reimagined to suit your needs. Conveniently located near schools, shopping, dining, and commuter routes, this property provides a solid foundation for those with vision. If you're ready to transform a home and create equity, this is the perfect canvas. Bring your tools and imagination—opportunities like this don’t come along often.
Features & Amenities
Property Details
Mortgage Calculator
Current Rates
Comparative Market Analysis
Affordable Tier · 5 active · 5 closed
Lancaster · Single Family Residence
Listed 9.7% below the median closed sale of $360,000. Price per sqft ($195) is a 21% discount to closed comps ($246).
Price Position
Priced below the market — value advantage over the field.
Active Properties (5)
Active Comparables
| Address | City | Year | BD | BTH | SqFt | LotSz | LP/SqFt | LP | DIM | Score |
|---|---|---|---|---|---|---|---|---|---|---|
| 43603 Gingham Avenue | Lancaster | 1955 | 3 | 2 | 1,608 | 6,521 | $229 | $369,000 | 12 | 86 |
| 137 Avenue J 8 | Lancaster | 1956 | 3 | 2 | 1,668 | 6,578 | $209 | $349,001 | 90 | 83 |
| 44846 Andale Avenue | Lancaster | 1957 | 3 | 2 | 1,107 | 7,841 | $334 | $369,900 | 15 | 81 |
| 1255 Herzel Avenue | Lancaster | 1985 | 3 | 2 | 1,390 | 7,480 | $205 | $285,000 | 1 | 78 |
| 45329 Rodin Avenue | Lancaster | 1957 | 4 | 2 | 1,246 | 6,816 | $297 | $369,999 | 10 | 77 |
| Total: 5 · Average | 3.2 | 2.0 | 1,403.8 | 7,047.2 | $254.8 | $348,580 | 25.6 | |||
| Median | 1,390 | $369,000 | ||||||||
Closed Properties (5)
Closed Comparables
| Address | City | Year | Date | BD | BTH | SqFt | LotSz | LP | SP | SP/SqFt | SP/LP | DIM | Score |
|---|---|---|---|---|---|---|---|---|---|---|---|---|---|
| 646 Nugent | Lancaster | 1957 | 06/18/2026 | 4 | 2 | 1,227 | 7,622 | $299,000 | $340,000 | $277 | 1.14 | 41 | 81 |
| 44866 Rodin Avenue | Lancaster | 1957 | 08/06/2026 | 3 | 2 | 1,186 | 7,677 | $300,000 | $300,000 | $253 | 1.00 | 49 | 81 |
| 44504 Watford Avenue | Lancaster | 1980 | 05/07/2026 | 3 | 2 | 1,390 | 6,236 | $379,000 | $370,000 | $266 | 0.98 | 379 | 78 |
| 1118 Avenue K | Lancaster | 1956 | 05/06/2026 | 3 | 2 | 1,724 | 16,407 | $399,000 | $365,000 | $212 | 0.92 | 100 | 78 |
| 44013 Raysack Avenue | Lancaster | 1972 | 11/07/2025 | 3 | 2 | 1,605 | 6,351 | $375,000 | $360,000 | $224 | 0.96 | 0 | 77 |
| Total: 5 · Average | 3.2 | 2.0 | 1,426.4 | 8,858.6 | $347,000 | $347,000 | $246.4 | — | 113.8 | ||||
| Median | 1,390 | $360,000 | $360,000 | ||||||||||
Market Analysis
List vs Sale $/SqFt
Sale Price Trend
Days on Market
Sale vs List Price
This analysis was generated automatically from MLS data. For an in-depth, human-reviewed valuation, contact Joseph Sardella at josephsardella@gmail.com.