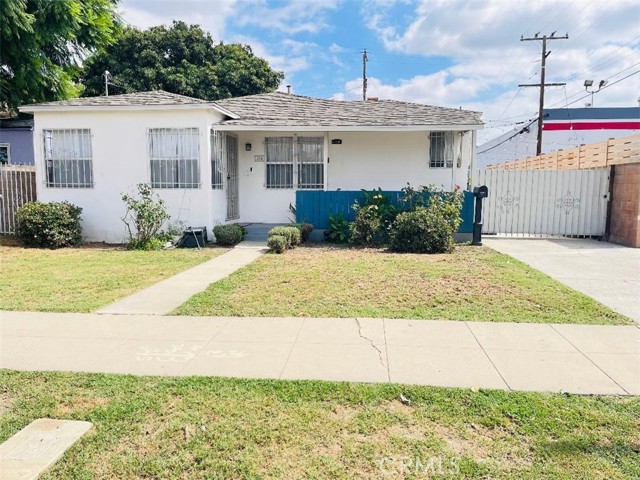
1110 North Pearl, Compton, CA 90221
1110 North Pearl, Compton, CA 90221
Property Description
****PRICE REDUCED ****** Great income opportunity live in one and rent out the back unit*** Welcome to this charming and well-maintained Compton home featuring 3 bedrooms and 1 bathroom. The inviting floor plan offers comfortable living and dining areas, newer vinyl flooring, and a convenient interior laundry area. The kitchen includes a stove and refrigerator and provides a functional space for everyday living. The property features a long driveway with parking for approximately 3 vehicles. A major highlight is the additional ADU 2-bedroom, 1-bathroom offering versatile space for extended family, guests, a home office, or potential rental use. The home also features solar panels installed in 2025 adding value and potential energy savings. (Buyer to assume solar panels loan) Conveniently located near schools, shopping, dining, transportation, and everyday amenities. A great opportunity for a homeowner or investor looking for a property with additional living space and plenty of possibilities.
Features & Amenities
Property Details
Mortgage Calculator
Current Rates
Comparative Market Analysis
Residential Tier · 5 active · 5 closed
Compton · Single Family Residence
Listed 8.8% above the median closed sale of $725,000. Price per sqft ($415) is a 26% discount to closed comps ($563). Closed comps sold at 102% of list — strong seller's market.
Price Position
Positioned above the market — commands a premium.
Active Properties (5)
Active Comparables
| Address | City | Year | BD | BTH | SqFt | LotSz | LP/SqFt | LP | DIM | Score |
|---|---|---|---|---|---|---|---|---|---|---|
| 4170 Lavinia | Lynwood | 1953 | 3 | 2 | 1,791 | 5,577 | $441 | $789,999 | 46 | 79 |
| 363 Spruce | Compton | 1928 | 3 | 2 | 1,361 | 5,025 | $533 | $724,900 | 4 | 79 |
| 2211 Grape Ave | Compton | 1947 | 4 | 3 | 2,018 | 5,001 | $343 | $693,000 | 41 | 77 |
| 1205 chester ave | Compton | 1947 | 4 | 2 | 1,464 | 6,002 | $546 | $800,000 | 6 | 76 |
| 12506 Mona | Compton | 2001 | 4 | 3 | 1,955 | 3,250 | $425 | $829,999 | 24 | 73 |
| Total: 5 · Average | 3.6 | 2.4 | 1,717.8 | 4,971 | $457.6 | $767,579.6 | 24.2 | |||
| Median | 1,791 | $789,999 | ||||||||
Closed Properties (5)
Closed Comparables
| Address | City | Year | Date | BD | BTH | SqFt | LotSz | LP | SP | SP/SqFt | SP/LP | DIM | Score |
|---|---|---|---|---|---|---|---|---|---|---|---|---|---|
| 1218 Spring Avenue | Compton | 1930 | 08/25/2026 | 3 | 2 | 1,309 | 5,784 | $739,999 | $760,000 | $581 | 1.03 | 82 | 80 |
| 1508 Queensdale | Compton | 1948 | 07/20/2026 | 3 | 2 | 1,393 | 6,271 | $699,900 | $700,000 | $503 | 1.00 | 93 | 78 |
| 1410 Willow Avenue | Compton | 1931 | 10/23/2026 | 3 | 1 | 1,232 | 5,143 | $710,000 | $725,000 | $588 | 1.02 | 71 | 75 |
| 611 Burris | Compton | 1928 | 04/13/2026 | 3 | 2 | 1,170 | 7,108 | $639,999 | $680,000 | $581 | 1.06 | 55 | 74 |
| 604 S Burris Ave | Compton | 1939 | 11/25/2025 | 3 | 1 | 1,353 | 7,071 | $749,000 | $760,000 | $562 | 1.01 | 26 | 73 |
| Total: 5 · Average | 3.0 | 1.6 | 1,291.4 | 6,275.4 | $725,000 | $725,000 | $563 | — | 65.4 | ||||
| Median | 1,309 | $725,000 | $725,000 | ||||||||||
Market Analysis
List vs Sale $/SqFt
Sale Price Trend
Days on Market
Sale vs List Price
This analysis was generated automatically from MLS data. For an in-depth, human-reviewed valuation, contact Joseph Sardella at josephsardella@gmail.com.