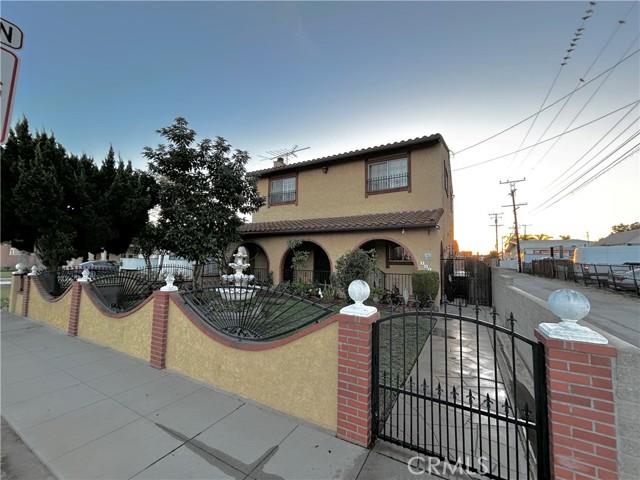
111 Everett, Monterey Park, CA 91755
111 Everett, Monterey Park, CA 91755
Property Description
A diamond asset ready for you! You don't want to miss it. A beautiful single-family home with 5 bedrooms, 3 baths, and a half bath in Monterey Park's vibrant downtown neighborhood. Features multiple living spaces, a front yard, a front porch, a rear patio, a swimming pool, and a large laundry room. Fruit-filled yards with avocado, pomegranate, lemon, and fig trees. Within walking distance to schools, banks, supermarkets, restaurants, stores, clinics, and shopping. A rare opportunity for comfortable living or strong investment potential in one of Monterey Park's most desirable areas. Great opportunity for a great location like this!
Features & Amenities
Property Details
Mortgage Calculator
Current Rates
Comparative Market Analysis
Residential Tier · 5 active · 5 closed
Monterey Park · Single Family Residence
Listed 6.9% above the median closed sale of $1,300,000. Price per sqft ($614) is a 15% premium to closed comps ($532). Closed comps sold at 106% of list — strong seller's market.
Price Position
Positioned above the market — commands a premium.
Active Properties (5)
Active Comparables
| Address | City | Year | BD | BTH | SqFt | LotSz | LP/SqFt | LP | DIM | Score |
|---|---|---|---|---|---|---|---|---|---|---|
| 309 Mcpherrin | Monterey Park | 1924 | 4 | 3 | 1,884 | 5,116 | $679 | $1.28M | 118 | 69 |
| 328 Lincoln Avenue | Monterey Park | 1995 | 5 | 5 | 3,084 | 6,183 | $502 | $1.55M | 19 | 66 |
| 704 Crest Vista Drive | Monterey Park | 1970 | 4 | 3 | 2,433 | 7,703 | $637 | $1.55M | 18 | 66 |
| 1531 Wilcox Avenue | Monterey Park | 1957 | 5 | 4 | 2,007 | 6,458 | $633 | $1.27M | 45 | 63 |
| 205 Bencamp | San Gabriel | 1948 | 5 | 4 | 2,323 | 6,470 | $601 | $1.40M | 82 | 63 |
| Total: 5 · Average | 4.6 | 3.8 | 2,346.2 | 6,386 | $610.4 | $1.41M | 56.4 | |||
| Median | 2,323 | $1.40M | ||||||||
Closed Properties (5)
Closed Comparables
| Address | City | Year | Date | BD | BTH | SqFt | LotSz | LP | SP | SP/SqFt | SP/LP | DIM | Score |
|---|---|---|---|---|---|---|---|---|---|---|---|---|---|
| 660 Bradshawe Avenue | Monterey Park | 1955 | 10/28/2026 | 4 | 3 | 1,779 | 9,834 | $1.33M | $1.27M | $713 | 0.95 | 92 | 68 |
| 209 Graves Avenue | Monterey Park | 1958 | 06/02/2026 | 5 | 4 | 3,512 | 8,186 | $1.54M | $1.21M | $345 | 0.79 | 85 | 65 |
| 208 Newmark Avenue | Monterey Park | 1999 | 02/17/2026 | 4 | 3 | 2,528 | 5,107 | $1.20M | $1.30M | $514 | 1.08 | 26 | 65 |
| 2712 New Ave | Rosemead | 2021 | 06/09/2026 | 5 | 5 | 2,792 | 7,075 | $1.18M | $1.58M | $566 | 1.34 | 107 | 64 |
| 406 Russell Avenue | Monterey Park | 1940 | 10/08/2026 | 5 | 5 | 2,577 | 12,613 | $1.20M | $1.35M | $524 | 1.13 | 43 | 63 |
| Total: 5 · Average | 4.6 | 4.0 | 2,637.6 | 8,563 | $1.34M | $1.34M | $532.4 | — | 70.6 | ||||
| Median | 2,577 | $1.30M | $1.30M | ||||||||||
Market Analysis
List vs Sale $/SqFt
Sale Price Trend
Days on Market
Sale vs List Price
This analysis was generated automatically from MLS data. For an in-depth, human-reviewed valuation, contact Joseph Sardella at josephsardella@gmail.com.