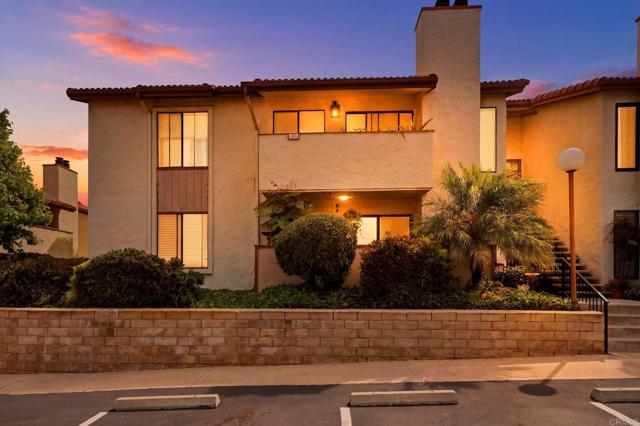
110 North 2nd Avenue, 30, Chula Vista, CA 91910
110 North 2nd Avenue, 30, Chula Vista, CA 91910
Property Description
A Great Opportunity to Own in Chula Vista! Discover the value and convenience of this move-in-ready, downstairs corner condo! Enjoy a comfortable layout filled with natural light, refreshing coastal breezes, and beautiful west-facing sunset views on clear days. Features include an in-unit washer and dryer, a detached one-car garage, plus additional parking. The FHA and VA-approved complex offers added financing flexibility for qualified buyers. Ideally located near the 805, 54, and 5 freeways, shopping, dining, parks, and everyday essentials. Whether you're a first-time buyer or looking to simplify your lifestyle, this is an opportunity worth exploring!
Features & Amenities
Property Details
Mortgage Calculator
Current Rates
Comparative Market Analysis
Affordable Tier · 5 active · 5 closed
Chula Vista · Condominium
Listed 5.6% below the median closed sale of $503,000.
Price Position
Priced below the market — value advantage over the field.
Active Properties (5)
Active Comparables
| Address | City | Year | BD | BTH | SqFt | LotSz | LP/SqFt | LP | DIM | Score |
|---|---|---|---|---|---|---|---|---|---|---|
| 573 Park Way | Chula Vista | 1980 | 2 | 2 | 980 | 0 | $485 | $475,000 | 4 | 86 |
| 465 Fourth Avenue | Chula Vista | 1980 | 2 | 2 | 1,047 | 33,977 | $478 | $500,000 | 34 | 84 |
| 1213 E Avenue | National City | 1980 | 3 | 2 | 978 | 91,476 | $486 | $475,000 | 39 | 83 |
| 569 st | Chula Vista | 1988 | 2 | 1 | 858 | 0 | $536 | $460,000 | 20 | 82 |
| 569 E Street | Chula Vista | 1988 | 1 | 2 | 835 | 0 | $596 | $498,000 | 21 | 81 |
| Total: 5 · Average | 2.0 | 1.8 | 939.6 | 62,726.5 | $516.2 | $481,600 | 23.6 | |||
| Median | 978 | $475,000 | ||||||||
Closed Properties (5)
Closed Comparables
| Address | City | Year | Date | BD | BTH | SqFt | LotSz | LP | SP | SP/SqFt | SP/LP | DIM | Score |
|---|---|---|---|---|---|---|---|---|---|---|---|---|---|
| 110 2Nd Avenue | Chula Vista | 1980 | 11/18/2025 | 2 | 2 | 1,003 | 172,062 | $530,000 | $530,000 | $528 | 1.00 | 82 | 94 |
| 149 Fourth Av | Chula Vista | 1965 | 07/17/2026 | 2 | 2 | 1,000 | 0 | $459,000 | $410,000 | $410 | 0.89 | 133 | 86 |
| 569 E Street | Chula Vista | 1988 | 07/21/2026 | 2 | 2 | 936 | 1 | $513,000 | $485,000 | $518 | 0.94 | 131 | 85 |
| 695 Sea Vale Street | Chula Vista | 1985 | 05/14/2026 | 2 | 2 | 1,000 | 68,389 | $499,000 | $503,000 | $503 | 1.01 | 60 | 84 |
| 376 Center St. | Chula Vista | 1981 | 10/06/2026 | 2 | 2 | 1,264 | 88,862 | $510,000 | $510,000 | $403 | 1.00 | 46 | 83 |
| Total: 5 · Average | 2.0 | 2.0 | 1,040.6 | 82,328.5 | $487,600 | $487,600 | $472.4 | — | 90.4 | ||||
| Median | 1,000 | $503,000 | $503,000 | ||||||||||
Market Analysis
List vs Sale $/SqFt
Sale Price Trend
Days on Market
Sale vs List Price
This analysis was generated automatically from MLS data. For an in-depth, human-reviewed valuation, contact Joseph Sardella at josephsardella@gmail.com.