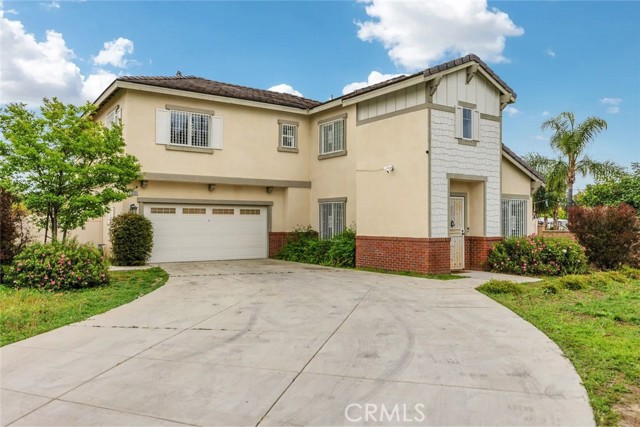
10995 Coalinga, Montclair, CA 91763
10995 Coalinga, Montclair, CA 91763
Property Description
Gorgeous home featuring a convenient downstairs bedroom. The spacious primary suite offers a double vanity master bath and a large walk-in closet. The welcoming entry opens to a bright living room filled with warm natural light, leading to a gourmet kitchen with a center island—perfect for cooking and entertaining. Ideally located close to the plaza, supermarkets, retail shops, and restaurants.
Features & Amenities
Property Details
Mortgage Calculator
Current Rates
Comparative Market Analysis
Residential Tier · 5 active · 5 closed
Montclair · Single Family Residence
Listed 11.2% above the median closed sale of $876,900. Closed comps sold at 101% of list — strong seller's market.
Price Position
Positioned above the market — commands a premium.
Active Properties (5)
Active Comparables
| Address | City | Year | BD | BTH | SqFt | LotSz | LP/SqFt | LP | DIM | Score |
|---|---|---|---|---|---|---|---|---|---|---|
| 4751 Howard | Montclair | 1961 | 4 | 2 | 1,571 | 7,200 | $566 | $889,900 | 5 | 79 |
| 11159 Carriage Avenue | Montclair | 1979 | 4 | 2 | 2,299 | 11,040 | $435 | $998,999 | 49 | 74 |
| 4653 Lombardy Court | Chino | 2002 | 4 | 3 | 3,279 | 7,661 | $302 | $990,000 | 6 | 74 |
| 1140 Francis | Ontario | 1981 | 4 | 2 | 2,080 | 17,000 | $505 | $1.05M | 5 | 67 |
| 9761 Helena | Montclair | 1957 | 4 | 3 | 1,328 | 7,540 | $640 | $849,900 | 3 | 67 |
| Total: 5 · Average | 4.0 | 2.4 | 2,111.4 | 10,088.2 | $489.6 | $955,759.8 | 13.6 | |||
| Median | 2,080 | $990,000 | ||||||||
Closed Properties (5)
Closed Comparables
| Address | City | Year | Date | BD | BTH | SqFt | LotSz | LP | SP | SP/SqFt | SP/LP | DIM | Score |
|---|---|---|---|---|---|---|---|---|---|---|---|---|---|
| 10957 Coalinga | Montclair | 2017 | 10/08/2026 | 4 | 3 | 2,316 | 8,231 | $866,900 | $876,900 | $379 | 1.01 | 30 | 96 |
| 5219 Azul | Chino | 2018 | 09/14/2026 | 4 | 3 | 2,547 | 4,007 | $790,000 | $830,000 | $326 | 1.05 | 38 | 85 |
| 11557 Cantara Dr | Chino | 2017 | 07/02/2026 | 4 | 3 | 2,547 | 4,004 | $849,900 | $830,000 | $326 | 0.98 | 56 | 85 |
| 4551 Monte Verde Street | Montclair | 1977 | 04/27/2026 | 4 | 2 | 2,416 | 20,211 | $1.10M | $1.10M | $455 | 1.00 | 47 | 72 |
| 4565 Grand Avenue | Montclair | 1977 | 09/21/2026 | 4 | 2 | 2,072 | 20,088 | $999,800 | $995,000 | $480 | 0.99 | 119 | 72 |
| Total: 5 · Average | 4.0 | 2.6 | 2,379.6 | 11,308.2 | $926,124 | $926,124 | $393.2 | — | 58 | ||||
| Median | 2,416 | $876,900 | $876,900 | ||||||||||
Market Analysis
List vs Sale $/SqFt
Sale Price Trend
Days on Market
Sale vs List Price
This analysis was generated automatically from MLS data. For an in-depth, human-reviewed valuation, contact Joseph Sardella at josephsardella@gmail.com.