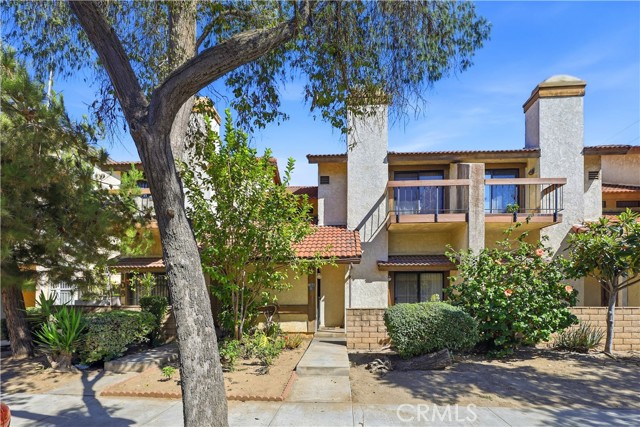
108 North Moore Avenue, B, Monterey Park, CA 91754
108 North Moore Avenue, B, Monterey Park, CA 91754
Property Description
BEAUTIFUL CONDO IN A PRIME MONTEREY PARK LOCATION! Conveniently located close to shopping, dining, schools, parks, and major transportation. This spacious 3-bedroom, 3-bathroom home features a LARGE LIVING ROOM, FORMAL DINING ROOM, and a comfortable, functional floor plan. Enjoy the COMMUNITY POOL and the convenience of being close to everything Monterey Park has to offer. A wonderful opportunity for homeowners looking for a spacious home in a highly convenient location. DON'T MISS THIS ONE!
Features & Amenities
Property Details
Mortgage Calculator
Current Rates
Comparative Market Analysis
Residential Tier · 5 active · 5 closed
Monterey Park · Townhouse
Listed in line with the median closed sale of $749,000.
Price Position
Aligned with the market — fair pricing for the comps.
Active Properties (5)
Active Comparables
| Address | City | Year | BD | BTH | SqFt | LotSz | LP/SqFt | LP | DIM | Score |
|---|---|---|---|---|---|---|---|---|---|---|
| 417 Baltimore Avenue | Monterey Park | 1987 | 4 | 4 | 1,743 | 18,947 | $441 | $768,000 | 12 | 84 |
| 332 Pomelo Avenue | Monterey Park | 1978 | 3 | 3 | 1,433 | 19,123 | $481 | $689,000 | 118 | 83 |
| 1620 5th | Alhambra | 1985 | 3 | 3 | 1,353 | 17,320 | $516 | $698,800 | 201 | 83 |
| 251 Casuda Canyon | Monterey Park | 1967 | 4 | 3 | 1,667 | 17,222 | $417 | $695,000 | 41 | 77 |
| 437 Orange Ave | Monterey Park | 1979 | 3 | 3 | 1,378 | 1,269 | $472 | $650,000 | 59 | 75 |
| Total: 5 · Average | 3.4 | 3.2 | 1,514.8 | 14,776.2 | $465.4 | $700,160 | 86.2 | |||
| Median | 1,433 | $695,000 | ||||||||
Closed Properties (5)
Closed Comparables
| Address | City | Year | Date | BD | BTH | SqFt | LotSz | LP | SP | SP/SqFt | SP/LP | DIM | Score |
|---|---|---|---|---|---|---|---|---|---|---|---|---|---|
| 226 Chandler | Monterey Park | 1983 | 10/09/2026 | 3 | 3 | 1,449 | 20,682 | $750,000 | $778,000 | $537 | 1.04 | 79 | 94 |
| 511 Mcpherrin Avenue | Monterey Park | 1984 | 10/15/2026 | 3 | 3 | 1,561 | 19,769 | $749,000 | $749,000 | $480 | 1.00 | 84 | 92 |
| 209 Chandler Avenue | Monterey Park | 1979 | 07/30/2026 | 3 | 3 | 1,479 | 27,702 | $808,000 | $800,000 | $541 | 0.99 | 68 | 89 |
| 322 Huntington | Monterey Park | 1981 | 02/19/2026 | 3 | 3 | 1,385 | 13,565 | $698,000 | $695,000 | $502 | 1.00 | 39 | 88 |
| 900 Mabel ave | Monterey Park | 1979 | 09/11/2026 | 2 | 3 | 1,425 | 1,350 | $688,000 | $650,000 | $456 | 0.94 | 53 | 80 |
| Total: 5 · Average | 2.8 | 3.0 | 1,459.8 | 16,613.6 | $734,400 | $734,400 | $503.2 | — | 64.6 | ||||
| Median | 1,449 | $749,000 | $749,000 | ||||||||||
Market Analysis
List vs Sale $/SqFt
Sale Price Trend
Days on Market
Sale vs List Price
This analysis was generated automatically from MLS data. For an in-depth, human-reviewed valuation, contact Joseph Sardella at josephsardella@gmail.com.