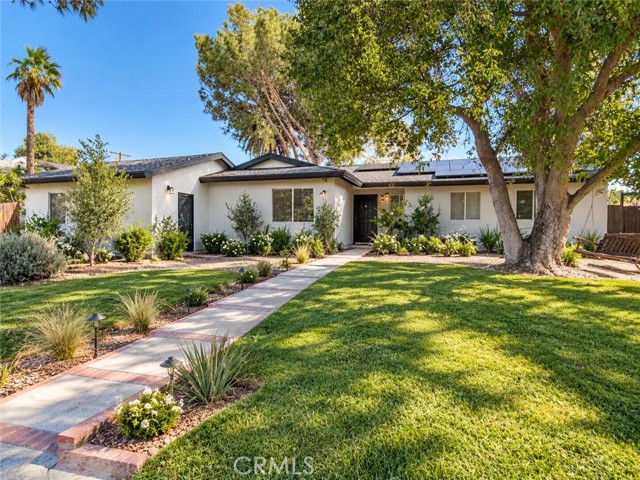
10740 Viking, Porter Ranch, CA 91326
10740 Viking, Porter Ranch, CA 91326
Property Description
Welcome to this Porter Ranch home offering a spacious lot, mature trees and plenty of potential. The property presents a great opportunity for a buyer looking to update, improve and make the home their own. The size and layout may offer ADU and/or JADU potential for additional living space, extended family, a home office or future rental use. Conveniently located near shopping, dining, parks, major freeways and highly regarded local schools. A solid opportunity in Porter Ranch with room to add value over time. Buyer to verify all ADU/JADU possibilities, permits, zoning, school information and requirements with the appropriate agencies.
Features & Amenities
Property Details
Mortgage Calculator
Current Rates
Comparative Market Analysis
Residential Tier · 5 active · 5 closed
Porter Ranch · Single Family Residence
Listed 13.2% above the median closed sale of $1,140,000. Price per sqft ($728) is a 26% premium to closed comps ($580).
Price Position
Positioned above the market — commands a premium.
Active Properties (5)
Active Comparables
| Address | City | Year | BD | BTH | SqFt | LotSz | LP/SqFt | LP | DIM | Score |
|---|---|---|---|---|---|---|---|---|---|---|
| 10543 Yolanda Avenue | Porter Ranch | 1961 | 3 | 2 | 1,559 | 11,019 | $741 | $1.16M | 10 | 82 |
| 10401 Amigo Avenue | Porter Ranch | 1961 | 4 | 2 | 2,329 | 11,421 | $623 | $1.45M | 90 | 77 |
| 10400 Canby Avenue | Porter Ranch | 1958 | 4 | 2 | 2,087 | 11,197 | $646 | $1.35M | 20 | 75 |
| 11258 Yolanda Avenue | Porter Ranch | 1966 | 4 | 3 | 2,436 | 10,423 | $595 | $1.45M | 59 | 75 |
| 11380 Reseda | Los Angeles | 1965 | 4 | 2 | 2,120 | 8,194 | $554 | $1.17M | 44 | 74 |
| Total: 5 · Average | 3.8 | 2.2 | 2,106.2 | 10,450.8 | $631.8 | $1.32M | 44.6 | |||
| Median | 2,120 | $1.35M | ||||||||
Closed Properties (5)
Closed Comparables
| Address | City | Year | Date | BD | BTH | SqFt | LotSz | LP | SP | SP/SqFt | SP/LP | DIM | Score |
|---|---|---|---|---|---|---|---|---|---|---|---|---|---|
| 10557 Reseda | Northridge | 1961 | 06/08/2026 | 4 | 3 | 1,735 | 10,208 | $1.19M | $1.19M | $686 | 1.00 | 92 | 86 |
| 10925 Yolanda | Porter Ranch | 1958 | 09/18/2026 | 4 | 2 | 1,933 | 12,828 | $1.18M | $1.14M | $590 | 0.97 | 49 | 82 |
| 18400 Bermuda Street | Los Angeles | 1959 | 08/27/2026 | 5 | 3 | 2,392 | 11,512 | $1.19M | $1.15M | $481 | 0.97 | 86 | 82 |
| 10953 Darby Avenue | Porter Ranch | 1958 | 04/30/2026 | 4 | 3 | 2,018 | 11,667 | $1.10M | $1.13M | $560 | 1.03 | 42 | 82 |
| 10983 Topeka Drive | Northridge | 1966 | 05/22/2026 | 4 | 2 | 1,920 | 8,411 | $1.14M | $1.12M | $585 | 0.98 | 37 | 78 |
| Total: 5 · Average | 4.2 | 2.6 | 1,999.6 | 10,925.2 | $1.15M | $1.15M | $580.4 | — | 61.2 | ||||
| Median | 1,933 | $1.14M | $1.14M | ||||||||||
Market Analysis
List vs Sale $/SqFt
Sale Price Trend
Days on Market
Sale vs List Price
This analysis was generated automatically from MLS data. For an in-depth, human-reviewed valuation, contact Joseph Sardella at josephsardella@gmail.com.