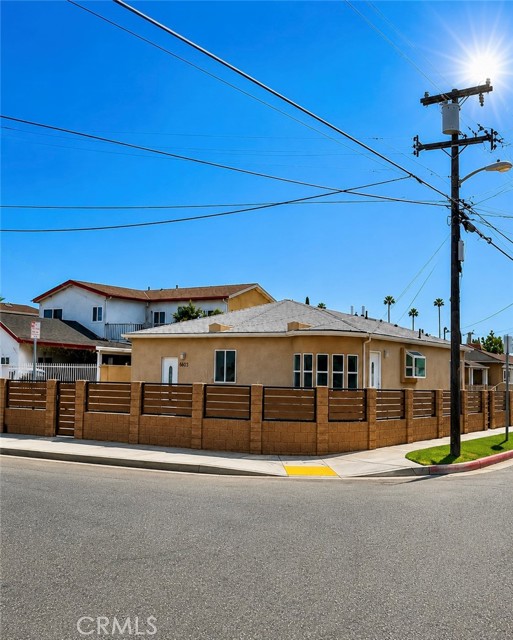
10603 South Osage, Inglewood, CA 90304
10603 South Osage, Inglewood, CA 90304
Property Description
***THE SELLER IS MOTIVATED AND OPEN TO REVIEWING COMPELLING OFFERS*** TWO UNITS • 5 BEDROOMS • 4 BATHROOMS • INCOME POTENTIAL! Looking for a home that gives you more options? This Inglewood duplex is a great opportunity to live in one unit and rent the other, bring extended family together while maintaining separate living spaces, or add a versatile income property to your portfolio. The front unit features 3 bedrooms and 3 bathrooms, while the rear unit offers 2 bedrooms and 1 bathroom. Enjoy a convenient location just minutes from SoFi Stadium, Intuit Dome, Kia Forum, Hollywood Park, LAX, shopping, dining, and major freeways. Buyers planning to make the property their home may also be eligible for seller assistance toward tenant relocation costs, depending on offer terms. Whether you're looking for a place to call home with additional income potential or your next investment, this property offers flexibility that's hard to find. Come see the possibilities for yourself! Photos were taken prior to tenant occupancy. Current rents $4095/month front unit and $2500/month back unit.
Features & Amenities
Property Details
Mortgage Calculator
Current Rates
Comparative Market Analysis
Residential Tier · 1 active · 5 closed
Inglewood · Duplex
Listed in line with the median closed sale of $925,000. Price per sqft ($381) is a 18% discount to closed comps ($462). Closed comps sold at 102% of list — strong seller's market.
Price Position
Aligned with the market — fair pricing for the comps.
Active Properties (1)
Active Comparables
| Address | City | Year | BD | BTH | SqFt | LotSz | LP/SqFt | LP | DIM | Score |
|---|---|---|---|---|---|---|---|---|---|---|
| 1739 105th Street | Los Angeles | 1947 | 5 | 3 | 2,305 | 7,494 | $347 | $799,999 | 161 | 68 |
| Total: 1 · Average | 5.0 | 3.0 | 2,305 | 7,494 | $347 | $799,999 | 161 | |||
| Median | 2,305 | $799,999 | ||||||||
Closed Properties (5)
Closed Comparables
| Address | City | Year | Date | BD | BTH | SqFt | LotSz | LP | SP | SP/SqFt | SP/LP | DIM | Score |
|---|---|---|---|---|---|---|---|---|---|---|---|---|---|
| 4125 Lennox | Inglewood | 1921 | 10/28/2026 | 5 | 2 | 2,006 | 10,101 | $899,990 | $920,000 | $459 | 1.02 | 36 | 72 |
| 2035 102nd Street | Los Angeles | 1947 | 04/22/2026 | 5 | 2 | 2,250 | 6,305 | $898,000 | $898,000 | $399 | 1.00 | 77 | 70 |
| 803 La Palma | Inglewood | 1941 | 07/07/2026 | 4 | 3 | 2,435 | 8,876 | $799,000 | $950,000 | $390 | 1.19 | 91 | 69 |
| 11894 Truro Avenue | Hawthorne | 1926 | 12/16/2025 | 4 | 3 | 1,530 | 6,098 | $999,000 | $960,000 | $627 | 0.96 | 276 | 68 |
| 7154 Ramsgate Avenue | Los Angeles | 1950 | 05/26/2026 | 4 | 2 | 2,136 | 6,040 | $999,950 | $925,000 | $433 | 0.93 | 84 | 55 |
| Total: 5 · Average | 4.4 | 2.4 | 2,071.4 | 7,484 | $930,600 | $930,600 | $461.6 | — | 112.8 | ||||
| Median | 2,136 | $925,000 | $925,000 | ||||||||||
Market Analysis
List vs Sale $/SqFt
Sale Price Trend
Days on Market
Sale vs List Price
This analysis was generated automatically from MLS data. For an in-depth, human-reviewed valuation, contact Joseph Sardella at josephsardella@gmail.com.