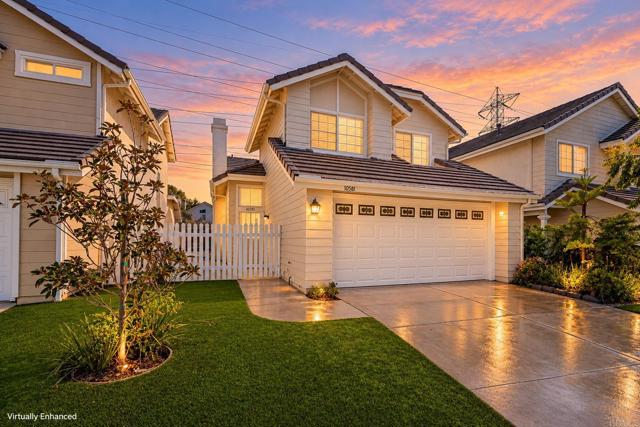
10581 Penridge Street, San Diego, CA 92126
10581 Penridge Street, San Diego, CA 92126
Property Description
LOCATION, LOCATION- Welcome home to this beautifully refreshed two-story residence in the desirable Mira Mesa community of Summerset Court! Offering 3 bedrooms and 2.5 baths, this inviting home combines comfortable living with a fresh, updated feel. Step inside to a bright and welcoming interior that has been freshly painted throughout, creating a clean and cohesive backdrop for any style. The kitchen is the heart of the home and has been thoughtfully updated with new cabinetry and new countertops, offering a fresh and contemporary look for everyday living and entertaining. The spacious two-story floor plan provides comfortable living spaces and a natural flow from room to room. Upstairs, the bedrooms offer privacy and separation from the main living areas. The home also features a 2-car attached garage and private outdoor space. Ideally situated near shopping, dining, schools, parks, and convenient transportation, this home puts everyday amenities close at hand. Fresh updates, an inviting floor plan, and a convenient Mira Mesa location come together to create a wonderful place to call home
Features & Amenities
Property Details
Mortgage Calculator
Current Rates
Comparative Market Analysis
Affordable Tier · 3 active · 5 closed
San Diego · Single Family Residence
Listed 3.7% above the median closed sale of $1,108,700. Price per sqft ($787) is a 12% premium to closed comps ($702).
Price Position
Aligned with the market — fair pricing for the comps.
Active Properties (3)
Active Comparables
| Address | City | Year | BD | BTH | SqFt | LotSz | LP/SqFt | LP | DIM | Score |
|---|---|---|---|---|---|---|---|---|---|---|
| 8243 Hydra Lane | San Diego | 1972 | 5 | 3 | 1,782 | 5,500 | $645 | $1.15M | 18 | 72 |
| 10472 Greenford Drive | San Diego | 1972 | 4 | 2 | 1,637 | 5,000 | $687 | $1.13M | 1 | 68 |
| 8631 Lepus Road | San Diego | 1972 | 3 | 2 | 1,040 | 5,200 | $961 | $999,900 | 32 | 67 |
| Total: 3 · Average | 4.0 | 2.3 | 1,486.333 | 5,233.333 | $764.333 | $1.09M | 17 | |||
| Median | 1,637 | $1.13M | ||||||||
Closed Properties (5)
Closed Comparables
| Address | City | Year | Date | BD | BTH | SqFt | LotSz | LP | SP | SP/SqFt | SP/LP | DIM | Score |
|---|---|---|---|---|---|---|---|---|---|---|---|---|---|
| 10679 Glendover Lane | San Diego | 1988 | 09/28/2026 | 4 | 3 | 1,795 | 3,920 | $1.20M | $1.20M | $669 | 1.00 | 26 | 88 |
| 10434 Cheviot Ct | San Diego | 1987 | 05/01/2026 | 3 | 2 | 1,666 | 5,590 | $1.15M | $1.11M | $665 | 0.96 | 74 | 86 |
| 10821 Wallingford Rd | San Diego | 1990 | 11/18/2025 | 4 | 3 | 1,920 | 5,237 | $1.23M | $1.23M | $641 | 1.00 | 41 | 80 |
| 7756 Flanders Drive | San Diego | 1984 | 01/15/2026 | 3 | 2 | 1,598 | 7,405 | $1.04M | $1.04M | $654 | 1.00 | 38 | 80 |
| 7929 Hemphill Drive | San Diego | 1980 | 08/04/2026 | 3 | 2 | 1,134 | 6,031 | $989,000 | $1.00M | $882 | 1.01 | 41 | 79 |
| Total: 5 · Average | 3.4 | 2.4 | 1,622.6 | 5,636.6 | $1.12M | $1.12M | $702.2 | — | 44 | ||||
| Median | 1,666 | $1.11M | $1.11M | ||||||||||
Market Analysis
List vs Sale $/SqFt
Sale Price Trend
Days on Market
Sale vs List Price
This analysis was generated automatically from MLS data. For an in-depth, human-reviewed valuation, contact Joseph Sardella at josephsardella@gmail.com.