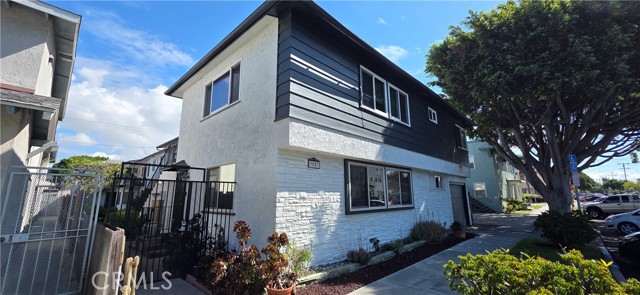
1057 East Appleton, Long Beach, CA 90802
1057 East Appleton, Long Beach, CA 90802
Property Description
Charming and well-maintained 1-bedroom, 1-bathroom unit in the heart of Long Beach. This inviting unit features an upgraded kitchen with modern finishes, offering both style and functionality. The open living space provides a comfortable layout with great natural light. The community includes a convenient on-site coin-operated laundry facility. Ideally located near shopping, dining, and local attractions, this home is perfect for first-time buyers, investors, or anyone seeking low-maintenance coastal living.
Features & Amenities
Property Details
Mortgage Calculator
Current Rates
Comparative Market Analysis
Affordable Tier · 1 active · 5 closed
Long Beach · Own Your Own
Listed 8.7% above the median closed sale of $275,000.
Price Position
Positioned above the market — commands a premium.
Active Properties (1)
Active Comparables
| Address | City | Year | BD | BTH | SqFt | LotSz | LP/SqFt | LP | DIM | Score |
|---|---|---|---|---|---|---|---|---|---|---|
| 440 Chestnut Avenue | Long Beach | 1962 | 1 | 1 | 654 | 7,506 | $505 | $329,999 | 17 | 88 |
| Total: 1 · Average | 1.0 | 1.0 | 654 | 7,506 | $505 | $329,999 | 17 | |||
| Median | 654 | $329,999 | ||||||||
Closed Properties (5)
Closed Comparables
| Address | City | Year | Date | BD | BTH | SqFt | LotSz | LP | SP | SP/SqFt | SP/LP | DIM | Score |
|---|---|---|---|---|---|---|---|---|---|---|---|---|---|
| 1260 4th Street | Long Beach | 1963 | 09/04/2025 | 1 | 1 | 655 | 9,014 | $285,000 | $260,000 | $397 | 0.91 | 190 | 86 |
| 82 Lime Avenue | Long Beach | 1953 | 04/22/2025 | 1 | 1 | 678 | 7,502 | $275,000 | $275,000 | $406 | 1.00 | 98 | 84 |
| 1321 Appleton Street | Long Beach | 1953 | 02/07/2025 | 1 | 1 | 697 | 8,269 | $345,000 | $342,450 | $491 | 0.99 | 28 | 83 |
| 930 1st | Long Beach | 1955 | 05/14/2026 | 0 | 1 | 377 | 11,139 | $265,000 | $260,000 | $690 | 0.98 | 27 | 81 |
| 1260 4th Street | Long Beach | 1963 | 07/03/2025 | 2 | 2 | 905 | 9,014 | $299,000 | $315,000 | $348 | 1.05 | 64 | 69 |
| Total: 5 · Average | 1.0 | 1.2 | 662.4 | 8,987.6 | $290,490 | $290,490 | $466.4 | — | 81.4 | ||||
| Median | 678 | $275,000 | $275,000 | ||||||||||
Market Analysis
List vs Sale $/SqFt
Sale Price Trend
Days on Market
Sale vs List Price
This analysis was generated automatically from MLS data. For an in-depth, human-reviewed valuation, contact Joseph Sardella at josephsardella@gmail.com.