10557 Mahoney, Sunland, CA 91040
10557 Mahoney, Sunland, CA 91040
Property Description
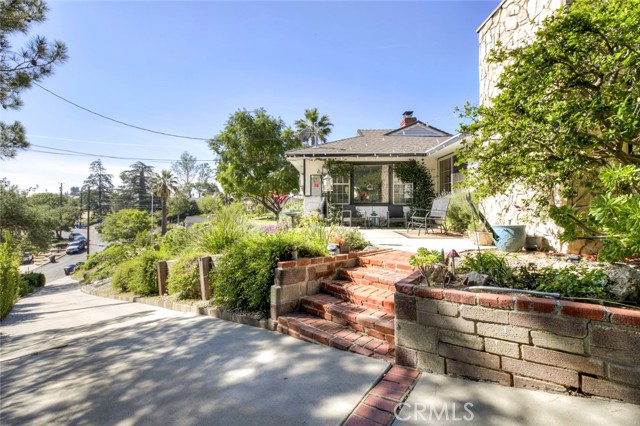
Welcome to 10557 Mahoney Dr in Shadow Hills. This 3 bedroom + office, 2 bathroom home offers 1,974 square feet of bright, comfortable living space on nearly half an acre. Set up on a hill, the home is very private and peaceful, with incredible views from the living room that might be some of the best in Shadow Hills. Natural light fills the main living space, and the separate dining/family room connects easily to the kitchen, creating a layout that works well for both everyday living and entertaining. All bedrooms are generously sized and filled with light, including a spacious primary suite with its own en suite bathroom. The 0.46-acre lot gives you room to breathe. There is space for horses, outdoor entertaining, gardening or other creative potentials. Properties with this much privacy, land, and views are hard to find. A rare opportunity to enjoy the best of Shadow Hills living.
Features & Amenities
Property Details
Mortgage Calculator
Current Rates
Comparative Market Analysis
Residential Tier · 5 active · 5 closed
Sunland · Single Family Residence
Listed in line with the median closed sale of $1,000,000. Price per sqft ($506) is a 14% discount to closed comps ($591).
Price Position
Aligned with the market — fair pricing for the comps.
Active Properties (5)
Active Comparables
| Address | City | Year | BD | BTH | SqFt | LotSz | LP/SqFt | LP | DIM | Score |
|---|---|---|---|---|---|---|---|---|---|---|
| 11575 Eldridge | Sylmar | 1950 | 3 | 2 | 1,937 | 19,246 | $542 | $1.05M | 169 | 76 |
| 10677 Ledeen | Lakeview Terrace | 1965 | 4 | 2 | 1,938 | 11,109 | $511 | $990,999 | 40 | 76 |
| 9701 La Canada Way | Los Angeles | 1957 | 4 | 3 | 2,024 | 18,625 | $538 | $1.09M | 25 | 72 |
| 11057 Fenway Street | Sun Valley | 1936 | 3 | 2 | 2,072 | 9,067 | $471 | $975,000 | 17 | 69 |
| 11342 Jeff Avenue | Lakeview Terrace | 1963 | 3 | 3 | 1,456 | 11,007 | $718 | $1.04M | 3 | 65 |
| Total: 5 · Average | 3.4 | 2.4 | 1,885.4 | 13,810.8 | $556 | $1.03M | 50.8 | |||
| Median | 1,938 | $1.04M | ||||||||
Closed Properties (5)
Closed Comparables
| Address | City | Year | Date | BD | BTH | SqFt | LotSz | LP | SP | SP/SqFt | SP/LP | DIM | Score |
|---|---|---|---|---|---|---|---|---|---|---|---|---|---|
| 10755 Wheatland Avenue | Sunland | 2019 | 06/24/2026 | 3 | 2 | 1,635 | 20,270 | $1.15M | $1.00M | $612 | 0.87 | 105 | 83 |
| 10525 Woldrich St. | Sylmar | 1963 | 10/20/2026 | 3 | 2 | 1,628 | 11,968 | $919,500 | $920,000 | $565 | 1.00 | 74 | 80 |
| 10136 Mcbroom | Sunland | 1958 | 06/16/2026 | 3 | 2 | 1,889 | 18,500 | $1.10M | $1.05M | $556 | 0.95 | 75 | 79 |
| 10550 Woldrich Street | Sylmar | 1963 | 09/23/2026 | 4 | 2 | 1,628 | 11,095 | $1.10M | $1.08M | $663 | 0.98 | 71 | 78 |
| 10527 Colebrook Street | Shadow Hills | 1961 | 09/17/2026 | 3 | 2 | 1,608 | 18,959 | $949,000 | $900,000 | $560 | 0.95 | 58 | 76 |
| Total: 5 · Average | 3.2 | 2.0 | 1,677.6 | 16,158.4 | $990,000 | $990,000 | $591.2 | — | 76.6 | ||||
| Median | 1,628 | $1.00M | $1.00M | ||||||||||
Market Analysis
List vs Sale $/SqFt
Sale Price Trend
Days on Market
Sale vs List Price
This analysis was generated automatically from MLS data. For an in-depth, human-reviewed valuation, contact Joseph Sardella at josephsardella@gmail.com.