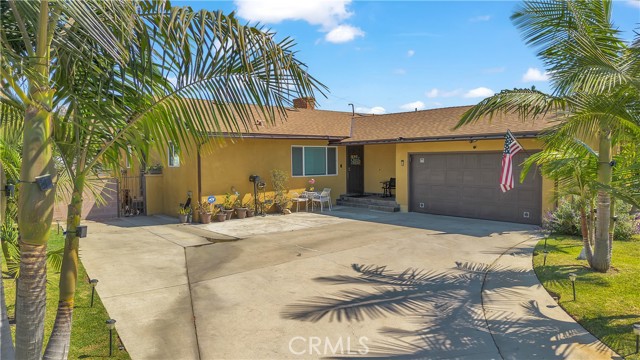
10548 Wiley Burke Ave, Downey, CA 90241
10548 Wiley Burke Ave, Downey, CA 90241
Property Description
Welcome to this beautifully updated 4-bedroom, 3-bathroom home located in the desirable Orange Estates community. This move-in-ready property features a remodeled kitchen with modern finishes, a renovated bathroom, and numerous updates throughout the home. Enjoy the warmth and elegance of hardwood flooring that flows seamlessly throughout the living spaces. The spacious floor plan offers comfort and functionality for everyday living and entertaining. With its tasteful upgrades and prime location, this home is ready for its next owner to enjoy. Bonus The garage has been converted into a spacious man cave, providing additional flex space perfect for entertaining, a game room, home gym, or hobby area
Features & Amenities
Property Details
Mortgage Calculator
Current Rates
Comparative Market Analysis
Residential Tier · 5 active · 5 closed
Downey · Single Family Residence
Listed 6.7% above the median closed sale of $1,125,000.
Price Position
Positioned above the market — commands a premium.
Active Properties (5)
Active Comparables
| Address | City | Year | BD | BTH | SqFt | LotSz | LP/SqFt | LP | DIM | Score |
|---|---|---|---|---|---|---|---|---|---|---|
| 8344 Lubec | Downey | 1957 | 3 | 3 | 1,959 | 8,088 | $613 | $1.20M | 11 | 86 |
| 9246 Manzanar | Downey | 1950 | 4 | 4 | 1,895 | 7,503 | $606 | $1.15M | 12 | 84 |
| 10530 Dolan Avenue | Downey | 1951 | 3 | 3 | 2,053 | 7,326 | $565 | $1.16M | 72 | 82 |
| 8635 Muller | Downey | 1962 | 4 | 3 | 2,341 | 9,109 | $513 | $1.20M | 67 | 81 |
| 7508 Rundell | Downey | 1942 | 3 | 3 | 1,933 | 5,180 | $543 | $1.05M | 2 | 79 |
| Total: 5 · Average | 3.4 | 3.2 | 2,036.2 | 7,441.2 | $568 | $1.15M | 32.8 | |||
| Median | 1,959 | $1.16M | ||||||||
Closed Properties (5)
Closed Comparables
| Address | City | Year | Date | BD | BTH | SqFt | LotSz | LP | SP | SP/SqFt | SP/LP | DIM | Score |
|---|---|---|---|---|---|---|---|---|---|---|---|---|---|
| 10253 Hopeland Avenue | Downey | 1953 | 05/20/2026 | 3 | 3 | 2,406 | 7,344 | $1.13M | $1.13M | $468 | 1.00 | 69 | 89 |
| 7534 Fostoria | Downey | 1950 | 01/06/2026 | 3 | 2 | 1,773 | 7,490 | $1.07M | $1.10M | $620 | 1.02 | 53 | 85 |
| 7333 Via Rio Nido | Downey | 1949 | 07/02/2026 | 3 | 3 | 2,521 | 8,979 | $1.40M | $1.36M | $541 | 0.98 | 113 | 85 |
| 10520 Wiley Burke | Downey | 1953 | 04/24/2026 | 3 | 2 | 1,372 | 8,719 | $1.07M | $1.06M | $773 | 0.99 | 25 | 84 |
| 7845 5th Street | Downey | 1946 | 11/19/2025 | 3 | 2 | 2,091 | 9,424 | $1.50M | $1.38M | $660 | 0.92 | 98 | 81 |
| Total: 5 · Average | 3.0 | 2.4 | 2,032.6 | 8,391.2 | $1.21M | $1.21M | $612.4 | — | 71.6 | ||||
| Median | 2,091 | $1.13M | $1.13M | ||||||||||
Market Analysis
List vs Sale $/SqFt
Sale Price Trend
Days on Market
Sale vs List Price
This analysis was generated automatically from MLS data. For an in-depth, human-reviewed valuation, contact Joseph Sardella at josephsardella@gmail.com.