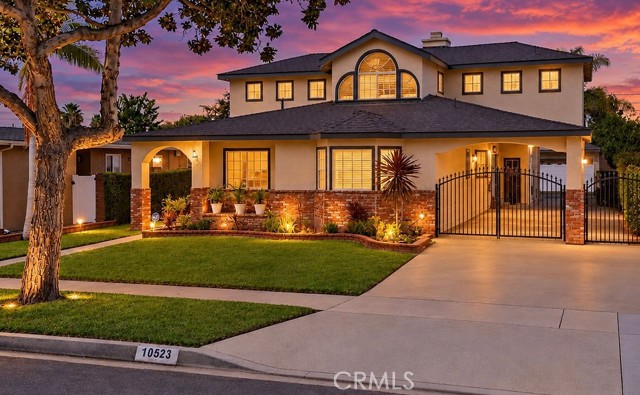
10523 Newville, Downey, CA 90241
10523 Newville, Downey, CA 90241
Property Description
Welcome to this beautifully remodeled home in a desirable area of Downey! Featuring 5 bedrooms, 3.25 bathrooms, and a spacious primary suite, this property offers plenty of room to accommodate a variety of living arrangements. Freshly updated from the inside out, this home showcases a brand-new kitchen, new flooring throughout, a new roof, and fresh interior and exterior paint. The thoughtful updates create a refreshed, inviting atmosphere, while the generous bedroom count offers flexibility for guests, a home office, or additional living space. Located in a prime area of Downey, this beautifully updated property presents an excellent opportunity to enjoy comfortable living in a sought-after community. With its recent improvements, spacious layout, and appealing location, this home is ready for its next owner to make it their own. A MUST-SEE opportunity in Downey! Schedule your private showing today
Features & Amenities
Property Details
Mortgage Calculator
Current Rates
Comparative Market Analysis
Luxury Tier · 5 active · 5 closed
Downey · Single Family Residence
Listed in line with the median closed sale of $1,750,000. Price per sqft ($456) is a 10% discount to closed comps ($507). Closed comps sold at 101% of list — strong seller's market. Luxury tier — fewer comparable sales widen the confidence range.
Price Position
Aligned with the market — fair pricing for the comps.
Active Properties (5)
Active Comparables
| Address | City | Year | BD | BTH | SqFt | LotSz | LP/SqFt | LP | DIM | Score |
|---|---|---|---|---|---|---|---|---|---|---|
| 9434 Pico Vista | Downey | 1966 | 5 | 3 | 3,503 | 6,278 | $492 | $1.72M | 131 | 81 |
| 10828 Pluton Street | Norwalk | 1952 | 6 | 3 | 1,822 | 8,003 | $799 | $1.46M | 61 | 79 |
| 10066 Sideview Drive | Downey | 1955 | 3 | 3 | 2,358 | 10,022 | $716 | $1.69M | 41 | 76 |
| 8349 Charloma | Downey | 1971 | 4 | 3 | 2,700 | 8,195 | $576 | $1.56M | 8 | 72 |
| 8906 Brock Avenue | Downey | 1956 | 5 | 4 | 3,510 | 11,580 | $511 | $1.79M | 117 | 56 |
| Total: 5 · Average | 4.6 | 3.2 | 2,778.6 | 8,815.6 | $618.8 | $1.64M | 71.6 | |||
| Median | 2,700 | $1.69M | ||||||||
Closed Properties (5)
Closed Comparables
| Address | City | Year | Date | BD | BTH | SqFt | LotSz | LP | SP | SP/SqFt | SP/LP | DIM | Score |
|---|---|---|---|---|---|---|---|---|---|---|---|---|---|
| 9123 Lemoran Avenue | Downey | 1951 | 12/19/2025 | 5 | 6 | 3,922 | 8,128 | $1.95M | $1.80M | $459 | 0.92 | 72 | 78 |
| 8560 Cherokee Drive | Downey | 1976 | 04/22/2026 | 4 | 4 | 3,166 | 10,164 | $1.60M | $1.45M | $458 | 0.91 | 70 | 75 |
| 10033 Brookshire | Downey | 1977 | 07/22/2026 | 4 | 2 | 2,145 | 7,430 | $1.35M | $1.46M | $678 | 1.08 | 45 | 69 |
| 9570 Gallatin Road | Downey | 1943 | 04/30/2026 | 3 | 3 | 3,699 | 17,187 | $1.68M | $1.95M | $527 | 1.16 | 27 | 67 |
| 9844 Pangborn | Downey | 1962 | 02/12/2026 | 7 | 4 | 4,256 | 10,769 | $1.75M | $1.75M | $411 | 1.00 | 38 | 64 |
| Total: 5 · Average | 4.6 | 3.8 | 3,437.6 | 10,735.6 | $1.68M | $1.68M | $506.6 | — | 50.4 | ||||
| Median | 3,699 | $1.75M | $1.75M | ||||||||||
Market Analysis
List vs Sale $/SqFt
Sale Price Trend
Days on Market
Sale vs List Price
This analysis was generated automatically from MLS data. For an in-depth, human-reviewed valuation, contact Joseph Sardella at josephsardella@gmail.com.