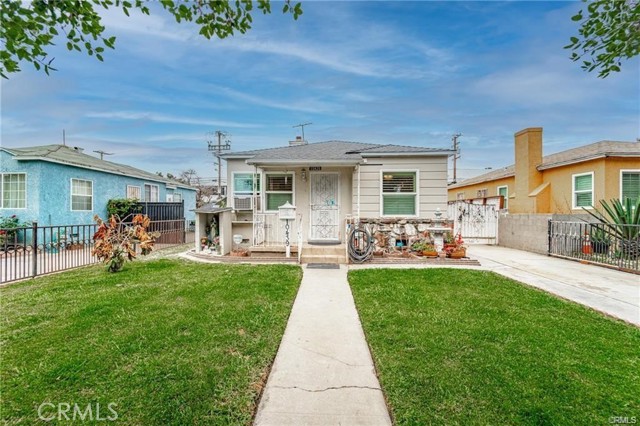
10439 Stanford Avenue, South Gate, CA 90280
10439 Stanford Avenue, South Gate, CA 90280
Property Description
Located in the city of South Gate, this centrally located home offers convenience and flexibility. It provides easy access to freeways, shopping centers, and schools, making it an ideal choice for families on the go. Upon entering the home, you'll find yourself in a warm and inviting living space. The interior offers both functionality and comfort. The home features 3 bedrooms, and 2 bathrooms providing plenty of space for multiple residents. The long driveway ensures ample parking space for everyone, leading to a detached 2 car garage that can be be an ideal candidate for and ADU.
Features & Amenities
Property Details
Mortgage Calculator
Current Rates
Comparative Market Analysis
Affordable Tier · 5 active · 5 closed
South Gate · Single Family Residence
Listed 3.6% above the median closed sale of $700,000. Price per sqft ($668) is a 23% premium to closed comps ($545). Closed comps sold at 103% of list — strong seller's market.
Price Position
Aligned with the market — fair pricing for the comps.
Active Properties (5)
Active Comparables
| Address | City | Year | BD | BTH | SqFt | LotSz | LP/SqFt | LP | DIM | Score |
|---|---|---|---|---|---|---|---|---|---|---|
| 2837 Kansas | South Gate | 1930 | 3 | 2 | 1,254 | 5,368 | $638 | $799,900 | 41 | 86 |
| 2938 Los Flores | Lynwood | 1960 | 3 | 2 | 1,156 | 4,281 | $601 | $695,000 | 102 | 85 |
| 10347 Kalmia Street | Los Angeles | 1963 | 3 | 2 | 1,317 | 6,502 | $543 | $715,000 | 78 | 82 |
| 10031 San Antonio | South Gate | 1924 | 4 | 2 | 1,209 | 4,169 | $599 | $724,000 | 9 | 81 |
| 10820 Capistrano | Lynwood | 1928 | 2 | 1 | 788 | 3,985 | $824 | $649,000 | 12 | 78 |
| Total: 5 · Average | 3.0 | 1.8 | 1,144.8 | 4,861 | $641 | $716,580 | 48.4 | |||
| Median | 1,209 | $715,000 | ||||||||
Closed Properties (5)
Closed Comparables
| Address | City | Year | Date | BD | BTH | SqFt | LotSz | LP | SP | SP/SqFt | SP/LP | DIM | Score |
|---|---|---|---|---|---|---|---|---|---|---|---|---|---|
| 10770 State Street | Lynwood | 1925 | 06/23/2026 | 3 | 2 | 1,089 | 3,419 | $599,900 | $650,000 | $597 | 1.08 | 61 | 85 |
| 3284 Cherokee Avenue | South Gate | 1945 | 05/22/2026 | 3 | 2 | 1,307 | 5,732 | $699,000 | $702,000 | $537 | 1.00 | 85 | 85 |
| 9933 San Anselmo | South Gate | 1928 | 06/29/2026 | 3 | 1 | 1,190 | 4,594 | $699,000 | $690,000 | $580 | 0.99 | 73 | 83 |
| 2652 109th | Lynwood | 1928 | 05/05/2026 | 2 | 1 | 1,200 | 4,606 | $660,000 | $700,000 | $583 | 1.06 | 55 | 81 |
| 10430 San Jose Avenue | South Gate | 1930 | 12/26/2025 | 3 | 2 | 1,862 | 6,131 | $774,999 | $800,000 | $430 | 1.03 | 165 | 67 |
| Total: 5 · Average | 2.8 | 1.6 | 1,329.6 | 4,896.4 | $708,400 | $708,400 | $545.4 | — | 87.8 | ||||
| Median | 1,200 | $700,000 | $700,000 | ||||||||||
Market Analysis
List vs Sale $/SqFt
Sale Price Trend
Days on Market
Sale vs List Price
This analysis was generated automatically from MLS data. For an in-depth, human-reviewed valuation, contact Joseph Sardella at josephsardella@gmail.com.