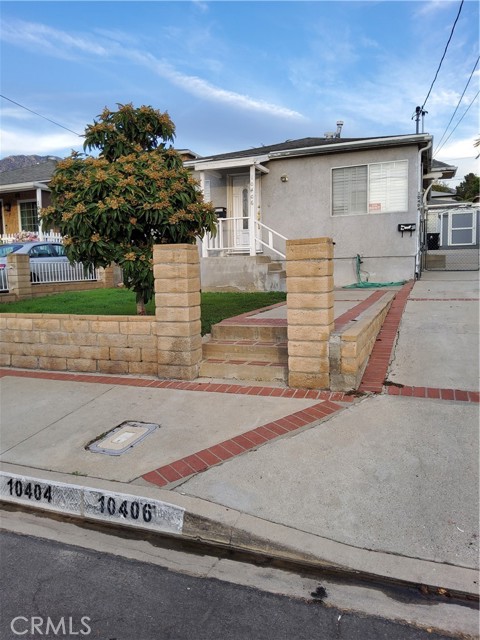
10406 Mcclemont, Tujunga, CA 91042
10406 Mcclemont, Tujunga, CA 91042
Property Description
2 plus 1, plus Adu ,Charming Tujunga property with front house 10406 McClemont 792 sqft, plus and detached ADU! Seprate address 10404 McClemont In the back Adu 329 sqft , Front house features central A/C and heating, copper plumbing, tankless gas water heater, stove, refrigerator, and indoor laundry hookups. Separate gas and electric meters for the front unit. Detached ADU seprate electric meter operates fully on electric, has its own electric meter, split A/C and heating, its own electric water heater, and electric laundry hookup. Both units share one water meter. Two storage units and plenty of parking space in the driveway. Great for multi-generational living or investment! Possibilities to add more.
Features & Amenities
Property Details
Mortgage Calculator
Current Rates
Comparative Market Analysis
Affordable Tier · 5 active · 5 closed
Tujunga · Single Family Residence
Listed 8.3% below the median closed sale of $1,200,000. Price per sqft ($981) is a 62% premium to closed comps ($607). Closed comps sold at 101% of list — strong seller's market.
Price Position
Priced below the market — value advantage over the field.
Active Properties (5)
Active Comparables
| Address | City | Year | BD | BTH | SqFt | LotSz | LP/SqFt | LP | DIM | Score |
|---|---|---|---|---|---|---|---|---|---|---|
| 10360 Mcclemont Avenue | Tujunga | 1946 | 3 | 2 | 1,427 | 5,781 | $701 | $999,999 | 172 | 80 |
| 7276 Summitrose Street | Tujunga | 1924 | 4 | 2 | 1,476 | 8,008 | $650 | $959,999 | 4 | 70 |
| 10641 Helendale | Tujunga | 1941 | 4 | 2 | 1,665 | 8,552 | $739 | $1.23M | 24 | 67 |
| 10405 Hillhaven Avenue | Los Angeles | 1939 | 4 | 3 | 1,916 | 10,139 | $626 | $1.20M | 105 | 56 |
| 7515 Mcgroarty | Tujunga | 1922 | 4 | 3 | 1,928 | 7,348 | $516 | $995,000 | 9 | 54 |
| Total: 5 · Average | 3.8 | 2.4 | 1,682.4 | 7,965.6 | $646.4 | $1.08M | 62.8 | |||
| Median | 1,665 | $999,999 | ||||||||
Closed Properties (5)
Closed Comparables
| Address | City | Year | Date | BD | BTH | SqFt | LotSz | LP | SP | SP/SqFt | SP/LP | DIM | Score |
|---|---|---|---|---|---|---|---|---|---|---|---|---|---|
| 7565 Mcgroarty Street | Tujunga | 1951 | 10/07/2026 | 3 | 3 | 1,854 | 4,583 | $1.20M | $1.20M | $647 | 1.00 | 64 | 68 |
| 7651 Valmont Street | Tujunga | 1965 | 12/04/2025 | 3 | 2 | 1,572 | 5,469 | $999,000 | $1.08M | $690 | 1.09 | 35 | 64 |
| 7315 Hillrose Street | Tujunga | 1948 | 08/03/2026 | 4 | 2 | 2,132 | 15,213 | $1.25M | $1.20M | $564 | 0.96 | 52 | 57 |
| 10508 Fernglen Avenue | Tujunga | 2008 | 10/21/2026 | 4 | 3 | 2,047 | 4,094 | $1.13M | $1.13M | $553 | 1.01 | 48 | 55 |
| 10533 Samoa Avenue | Tujunga | 1976 | 02/11/2026 | 4 | 3 | 2,106 | 14,083 | $1.20M | $1.22M | $579 | 1.02 | 36 | 42 |
| Total: 5 · Average | 3.6 | 2.6 | 1,942.2 | 8,688.4 | $1.17M | $1.17M | $606.6 | — | 47 | ||||
| Median | 2,047 | $1.20M | $1.20M | ||||||||||
Market Analysis
List vs Sale $/SqFt
Sale Price Trend
Days on Market
Sale vs List Price
This analysis was generated automatically from MLS data. For an in-depth, human-reviewed valuation, contact Joseph Sardella at josephsardella@gmail.com.