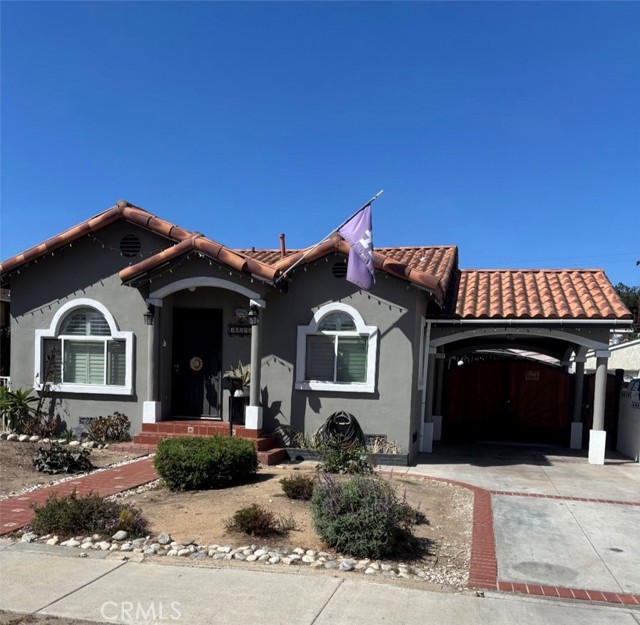
10323 San Luis, South Gate, CA 90280
10323 San Luis, South Gate, CA 90280
Property Description
Welcome to this 4-bedroom 2-bathroom South Gate home offering 1562 sqft of space, character, and plenty of room to make it your own. Inside hardwood floors and ceiling fans add warmth and comfort, while the spacious layout gives you room to liv, work and entertain and grow. And then there's the detached garage- a feature that gives you the flexibility for parking, storage, a workshop, or whatever fits your lifestyle. This isn't about being the biggest house on the block. It's about having the space, location, and potential to create something that feels like a home.
Features & Amenities
Property Details
Mortgage Calculator
Current Rates
Comparative Market Analysis
Residential Tier · 5 active · 5 closed
South Gate · Single Family Residence
Listed 6.4% above the median closed sale of $750,000. Closed comps sold at 101% of list — strong seller's market.
Price Position
Positioned above the market — commands a premium.
Active Properties (5)
Active Comparables
| Address | City | Year | BD | BTH | SqFt | LotSz | LP/SqFt | LP | DIM | Score |
|---|---|---|---|---|---|---|---|---|---|---|
| 10031 San Antonio | South Gate | 1924 | 4 | 2 | 1,209 | 4,169 | $599 | $724,000 | 9 | 80 |
| 10340 Jackson Avenue | South Gate | 1939 | 3 | 2 | 1,325 | 4,995 | $596 | $789,900 | 13 | 78 |
| 3405 Elizabeth | Lynwood | 2022 | 4 | 3 | 1,660 | 9,786 | $461 | $765,000 | 38 | 78 |
| 11098 Hulme | Lynwood | 1942 | 3 | 3 | 1,524 | 5,988 | $495 | $755,000 | 176 | 78 |
| 10247 Jackson Avenue | South Gate | 1940 | 2 | 1 | 1,101 | 5,007 | $658 | $725,000 | 31 | 74 |
| Total: 5 · Average | 3.2 | 2.2 | 1,363.8 | 5,989 | $561.8 | $751,780 | 53.4 | |||
| Median | 1,325 | $755,000 | ||||||||
Closed Properties (5)
Closed Comparables
| Address | City | Year | Date | BD | BTH | SqFt | LotSz | LP | SP | SP/SqFt | SP/LP | DIM | Score |
|---|---|---|---|---|---|---|---|---|---|---|---|---|---|
| 10526 San Miguel | South Gate | 1941 | 08/05/2026 | 3 | 2 | 1,553 | 7,332 | $800,000 | $800,000 | $515 | 1.00 | 19 | 89 |
| 10001 Bowman Avenue | South Gate | 1939 | 05/22/2026 | 4 | 2 | 1,790 | 6,496 | $715,000 | $730,000 | $408 | 1.02 | 65 | 84 |
| 4237 Abbott Rd | Lynwood | 1948 | 05/29/2026 | 3 | 2 | 1,434 | 5,993 | $699,999 | $720,000 | $502 | 1.03 | 67 | 82 |
| 9832 San Miguel Avenue | South Gate | 1951 | 06/26/2026 | 4 | 3 | 1,475 | 4,280 | $749,900 | $760,000 | $515 | 1.01 | 98 | 80 |
| 4159 Abbott Road | Lynwood | 1948 | 02/27/2026 | 3 | 2 | 1,392 | 6,534 | $750,000 | $750,000 | $539 | 1.00 | 43 | 79 |
| Total: 5 · Average | 3.4 | 2.2 | 1,528.8 | 6,127 | $752,000 | $752,000 | $495.8 | — | 58.4 | ||||
| Median | 1,475 | $750,000 | $750,000 | ||||||||||
Market Analysis
List vs Sale $/SqFt
Sale Price Trend
Days on Market
Sale vs List Price
This analysis was generated automatically from MLS data. For an in-depth, human-reviewed valuation, contact Joseph Sardella at josephsardella@gmail.com.