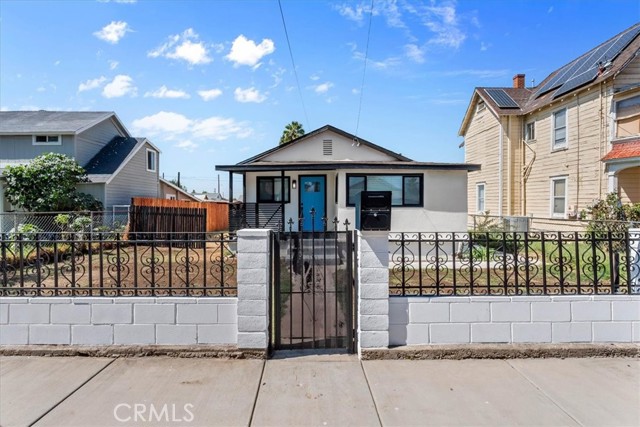
1011 Tribune, Redlands, CA 92374
1011 Tribune, Redlands, CA 92374
Property Description
Completely remodeled 2-bedroom, 1-bath home located in desirable North Redlands, within walking distance to Downtown Redlands. This beautifully updated home features new exterior stucco, new windows, and a fresh interior with new waterproof flooring and paint throughout. The kitchen has been upgraded with new cabinets, while the bathroom has been completely remodeled. Enjoy a large patio, perfect for family gatherings and entertaining. Situated on a large lot with convenient alley access, this property offers excellent potential for an ADU or additional future development. A great opportunity for a homeowner or investor looking for a move-in-ready property in a highly desirable Redlands location.
Features & Amenities
Property Details
Mortgage Calculator
Current Rates
Comparative Market Analysis
Affordable Tier · 4 active · 5 closed
Redlands · Single Family Residence
Listed 3.6% below the median closed sale of $415,000. Closed comps sold at 102% of list — strong seller's market.
Price Position
Aligned with the market — fair pricing for the comps.
Active Properties (4)
Active Comparables
| Address | City | Year | BD | BTH | SqFt | LotSz | LP/SqFt | LP | DIM | Score |
|---|---|---|---|---|---|---|---|---|---|---|
| 140 Pioneer | Redlands | 1989 | 2 | 2 | 1,101 | 4,368 | $380 | $418,000 | 67 | 66 |
| 1555 Orange | Redlands | 2005 | 2 | 3 | 1,122 | 1,550 | $388 | $435,000 | 34 | 55 |
| 140 Pioneer | Redlands | 1989 | 3 | 2 | 1,558 | 4,368 | $292 | $455,000 | 9 | 51 |
| 140 W Pioneer Ave | Redlands | 1988 | 3 | 2 | 1,574 | 4,368 | $286 | $450,000 | 60 | 49 |
| Total: 4 · Average | 2.5 | 2.3 | 1,338.75 | 3,663.5 | $336.5 | $439,500 | 42.5 | |||
| Median | 1,558 | $450,000 | ||||||||
Closed Properties (5)
Closed Comparables
| Address | City | Year | Date | BD | BTH | SqFt | LotSz | LP | SP | SP/SqFt | SP/LP | DIM | Score |
|---|---|---|---|---|---|---|---|---|---|---|---|---|---|
| 1016 Webster | Redlands | 1955 | 09/17/2026 | 2 | 1 | 848 | 7,504 | $399,000 | $405,000 | $478 | 1.01 | 29 | 90 |
| 1012 Washington | Redlands | 1999 | 10/13/2026 | 2 | 1 | 976 | 6,480 | $349,000 | $360,000 | $369 | 1.03 | 47 | 85 |
| 215 W Lugonia Ave | Redlands | 1936 | 10/07/2026 | 3 | 1 | 732 | 3,000 | $449,900 | $440,000 | $601 | 0.98 | 189 | 84 |
| 1208 Ohio | Redlands | 1944 | 01/29/2026 | 2 | 1 | 651 | 6,517 | $399,999 | $415,000 | $637 | 1.04 | 45 | 82 |
| 1025 Clay Street | Redlands | 1910 | 12/05/2025 | 2 | 1 | 864 | 6,480 | $440,000 | $450,000 | $521 | 1.02 | 57 | 79 |
| Total: 5 · Average | 2.2 | 1.0 | 814.2 | 5,996.2 | $414,000 | $414,000 | $521.2 | — | 73.4 | ||||
| Median | 848 | $415,000 | $415,000 | ||||||||||
Market Analysis
List vs Sale $/SqFt
Sale Price Trend
Days on Market
Sale vs List Price
This analysis was generated automatically from MLS data. For an in-depth, human-reviewed valuation, contact Joseph Sardella at josephsardella@gmail.com.