10012 Plainview Avenue, Tujunga, CA 91042
10012 Plainview Avenue, Tujunga, CA 91042
Property Description
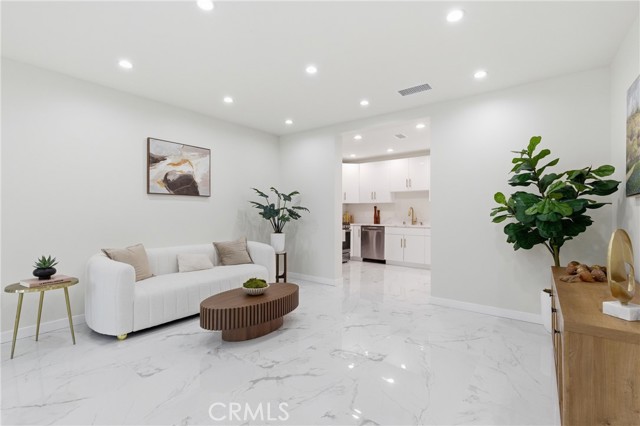
Attention Investors !!! • Rare turnkey property with income potential • 3 Bed | 2 Bath fully remodeled main home (1,415 Sq. Ft.) • Newly built, fully permitted 3 Bed | 2 Bath ADU • Potential 3-unit configuration • Move-in ready with modern designer finishes • Contemporary kitchen with premium cabinetry, sleek tile flooring, brand new appliances & gold fixtures • Dedicated 2-car parking for each unit • Ideal for owner-occupants, multi-generational living, or investment • Live in one unit while generating rental income from the other • Exceptional flexibility with strong cash-flow potential
Features & Amenities
Property Details
Mortgage Calculator
Current Rates
Comparative Market Analysis
Residential Tier · 5 active · 5 closed
Tujunga · Single Family Residence
Listed 8.4% above the median closed sale of $1,132,000. Closed comps sold at 101% of list — strong seller's market.
Price Position
Positioned above the market — commands a premium.
Active Properties (5)
Active Comparables
| Address | City | Year | BD | BTH | SqFt | LotSz | LP/SqFt | LP | DIM | Score |
|---|---|---|---|---|---|---|---|---|---|---|
| 9452 Reverie Road | Tujunga | 2026 | 5 | 5 | 2,222 | 5,007 | $608 | $1.35M | 12 | 78 |
| 10109 Parr | Sunland | 1949 | 3 | 3 | 2,060 | 6,398 | $581 | $1.20M | 38 | 74 |
| 10405 Hillhaven Avenue | Los Angeles | 1939 | 4 | 3 | 1,916 | 10,139 | $626 | $1.20M | 105 | 71 |
| 10641 Helendale | Tujunga | 1941 | 4 | 2 | 1,665 | 8,552 | $739 | $1.23M | 24 | 68 |
| 10267 Tujunga Canyon Boulevard | Tujunga | 1936 | 3 | 2 | 1,736 | 14,985 | $746 | $1.29M | 31 | 65 |
| Total: 5 · Average | 3.8 | 3.0 | 1,919.8 | 9,016.2 | $660 | $1.25M | 42 | |||
| Median | 1,916 | $1.23M | ||||||||
Closed Properties (5)
Closed Comparables
| Address | City | Year | Date | BD | BTH | SqFt | LotSz | LP | SP | SP/SqFt | SP/LP | DIM | Score |
|---|---|---|---|---|---|---|---|---|---|---|---|---|---|
| 7565 Mcgroarty Street | Tujunga | 1951 | 10/07/2026 | 3 | 3 | 1,854 | 4,583 | $1.20M | $1.20M | $647 | 1.00 | 64 | 77 |
| 8126 Cora Street | Los Angeles | 1988 | 09/09/2026 | 4 | 3 | 2,182 | 8,392 | $1.20M | $1.28M | $587 | 1.07 | 56 | 74 |
| 7961 Apperson Street | Sunland | 1948 | 12/24/2025 | 4 | 4 | 1,801 | 5,925 | $1.10M | $1.11M | $618 | 1.01 | 50 | 73 |
| 10508 Fernglen Avenue | Tujunga | 2008 | 10/21/2026 | 4 | 3 | 2,047 | 4,094 | $1.13M | $1.13M | $553 | 1.01 | 48 | 73 |
| 10227 Parr Avenue | Sunland | 1948 | 05/08/2026 | 4 | 5 | 2,571 | 6,452 | $1.10M | $1.07M | $416 | 0.97 | 56 | 71 |
| Total: 5 · Average | 3.8 | 3.6 | 2,091 | 5,889.2 | $1.16M | $1.16M | $564.2 | — | 54.8 | ||||
| Median | 2,047 | $1.13M | $1.13M | ||||||||||
Market Analysis
List vs Sale $/SqFt
Sale Price Trend
Days on Market
Sale vs List Price
This analysis was generated automatically from MLS data. For an in-depth, human-reviewed valuation, contact Joseph Sardella at josephsardella@gmail.com.