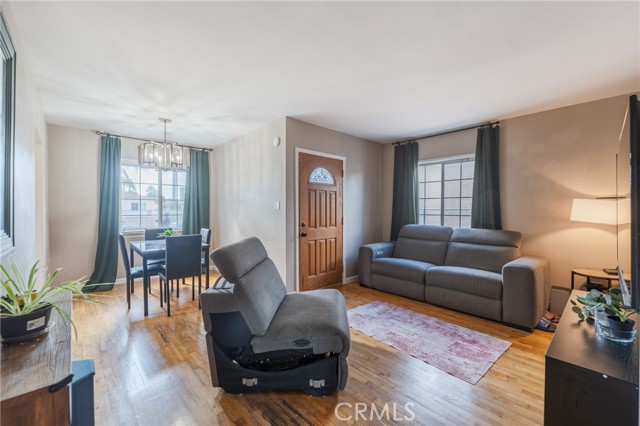
1001 Jay, Torrance, CA 90502
1001 Jay, Torrance, CA 90502
Property Description
Opportunity knocks at 1001 Jay Street! Situated on a cul-de-sac, this two-bedroom, one-bath home offers an exciting opportunity for first-time buyers ready to plant roots or investors looking for their next project. Spacious bedrooms, a separate dining area, and washer and dryer hookups add comfort and everyday convenience. The expansive backyard sets the stage for weekend gatherings, gardening, and creating your own outdoor retreat. Bring your imagination and personal touches to unlock this home’s potential. Conveniently located near shopping and freeway access, this Torrance property is ready for your vision.
Features & Amenities
Property Details
Mortgage Calculator
Current Rates
Comparative Market Analysis
Affordable Tier · 5 active · 5 closed
Torrance · Single Family Residence
Listed 3.6% below the median closed sale of $700,000. Closed comps sold at 104% of list — strong seller's market.
Price Position
Aligned with the market — fair pricing for the comps.
Active Properties (5)
Active Comparables
| Address | City | Year | BD | BTH | SqFt | LotSz | LP/SqFt | LP | DIM | Score |
|---|---|---|---|---|---|---|---|---|---|---|
| 1020 220th | Torrance | 1952 | 2 | 1 | 812 | 5,939 | $799 | $649,000 | 59 | 97 |
| 1505 220th | Torrance | 1951 | 2 | 1 | 873 | 6,002 | $778 | $679,000 | 191 | 88 |
| 23327 Orchard | Carson | 1954 | 3 | 1 | 924 | 4,963 | $774 | $715,000 | 58 | 85 |
| 22620 Menlo | Torrance | 1954 | 3 | 2 | 1,267 | 3,844 | $599 | $759,000 | 40 | 71 |
| 22443 Meyler Street | Torrance | 1927 | 3 | 2 | 1,487 | 5,063 | $518 | $771,000 | 83 | 62 |
| Total: 5 · Average | 2.6 | 1.4 | 1,072.6 | 5,162.2 | $693.6 | $714,600 | 86.2 | |||
| Median | 924 | $715,000 | ||||||||
Closed Properties (5)
Closed Comparables
| Address | City | Year | Date | BD | BTH | SqFt | LotSz | LP | SP | SP/SqFt | SP/LP | DIM | Score |
|---|---|---|---|---|---|---|---|---|---|---|---|---|---|
| 806 219th Street | Torrance | 1953 | 04/17/2026 | 2 | 1 | 820 | 4,494 | $699,999 | $730,000 | $890 | 1.04 | 57 | 93 |
| 22720 Orchard | Carson | 1953 | 06/16/2026 | 2 | 1 | 819 | 4,619 | $599,900 | $610,000 | $745 | 1.02 | 43 | 92 |
| 1503 224th | Torrance | 1953 | 06/29/2026 | 2 | 1 | 794 | 5,001 | $699,999 | $690,000 | $869 | 0.99 | 96 | 88 |
| 21259 Lynton | Carson | 1953 | 06/05/2026 | 2 | 1 | 876 | 5,486 | $665,000 | $700,000 | $799 | 1.05 | 38 | 88 |
| 1326 223rd Street | Los Angeles | 1947 | 08/28/2026 | 2 | 1 | 924 | 8,280 | $625,000 | $700,000 | $758 | 1.12 | 33 | 88 |
| Total: 5 · Average | 2.0 | 1.0 | 846.6 | 5,576 | $686,000 | $686,000 | $812.2 | — | 53.4 | ||||
| Median | 820 | $700,000 | $700,000 | ||||||||||
Market Analysis
List vs Sale $/SqFt
Sale Price Trend
Days on Market
Sale vs List Price
This analysis was generated automatically from MLS data. For an in-depth, human-reviewed valuation, contact Joseph Sardella at josephsardella@gmail.com.