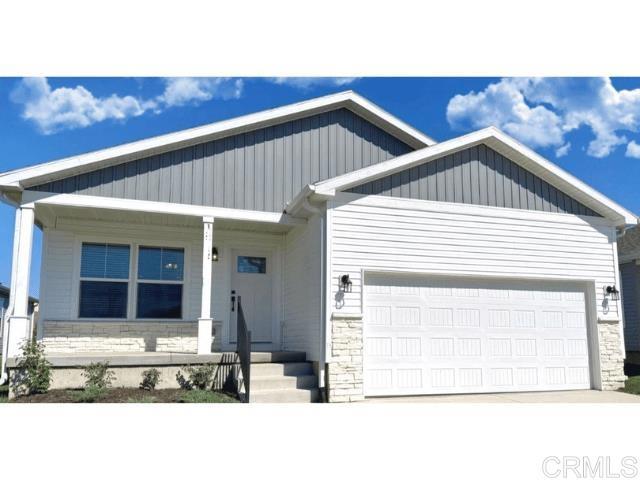
0 30th Ste Vic Avenue Avenue, Lancaster, CA 93535
0 30th Ste Vic Avenue Avenue, Lancaster, CA 93535
Property Description
New Construction on Massive 1/2 acre lot with NO HOA & Special Financing Available!! This home features an open floor plan with 2 car garage -- lot has enough space to lot split, add another home, add 2 ADUs a pool, your toys, a garden, and more! Smart home features Low E Argon Windows, Hi R Value (Energy Efficient) - Close to Antelope Valley College, Lancaster National Soccer Center, Shopping, Community Pools & Fitness & More! Note: current parcel is 2 acres and parcel map is pending lot split into 24,163sf lot. Images are of previous built homes with same floor plan.
Features & Amenities
Property Details
Mortgage Calculator
Current Rates
Comparative Market Analysis
Residential Tier · 5 active · 5 closed
Lancaster · Single Family Residence
Listed 11.4% above the median closed sale of $480,000. Price per sqft ($330) is a 20% premium to closed comps ($275).
Price Position
Positioned above the market — commands a premium.
Active Properties (5)
Active Comparables
| Address | City | Year | BD | BTH | SqFt | LotSz | LP/SqFt | LP | DIM | Score |
|---|---|---|---|---|---|---|---|---|---|---|
| 1325 Avenue H6 | Lancaster | 2002 | 4 | 2 | 1,890 | 6,249 | $264 | $499,900 | 25 | 69 |
| 1855 Stratford Street | Lancaster | 2000 | 4 | 3 | 2,162 | 6,264 | $250 | $540,000 | 45 | 64 |
| 1553 Holguin Street | Lancaster | 2025 | 5 | 3 | 2,510 | 8,093 | $237 | $595,990 | 41 | 62 |
| 1606 Regents Street | Lancaster | 2001 | 5 | 3 | 2,851 | 9,500 | $202 | $574,888 | 59 | 60 |
| 1222 Valiant Street | Lancaster | 2001 | 5 | 3 | 2,792 | 6,986 | $202 | $565,000 | 19 | 53 |
| Total: 5 · Average | 4.6 | 2.8 | 2,441 | 7,418.4 | $231 | $555,155.6 | 37.8 | |||
| Median | 2,510 | $565,000 | ||||||||
Closed Properties (5)
Closed Comparables
| Address | City | Year | Date | BD | BTH | SqFt | LotSz | LP | SP | SP/SqFt | SP/LP | DIM | Score |
|---|---|---|---|---|---|---|---|---|---|---|---|---|---|
| 45858 Coventry Court | Lancaster | 2001 | 05/20/2026 | 3 | 2 | 1,350 | 7,342 | $459,900 | $459,900 | $341 | 1.00 | 37 | 74 |
| 45641 Knightsbridge Street | Lancaster | 1999 | 06/26/2026 | 3 | 2 | 1,880 | 5,686 | $460,000 | $460,000 | $245 | 1.00 | 105 | 71 |
| 1522 Sutherland Street | Lancaster | 2001 | 10/02/2026 | 3 | 2 | 1,590 | 6,592 | $499,999 | $505,000 | $318 | 1.01 | 44 | 70 |
| 1840 Holguin | Lancaster | 2000 | 06/09/2026 | 3 | 2 | 1,880 | 5,668 | $480,000 | $480,000 | $255 | 1.00 | 60 | 70 |
| 45614 Barham | Lancaster | 2002 | 05/15/2026 | 3 | 3 | 2,220 | 6,589 | $490,000 | $480,000 | $216 | 0.98 | 91 | 69 |
| Total: 5 · Average | 3.0 | 2.2 | 1,784 | 6,375.4 | $476,980 | $476,980 | $275 | — | 67.4 | ||||
| Median | 1,880 | $480,000 | $480,000 | ||||||||||
Market Analysis
List vs Sale $/SqFt
Sale Price Trend
Days on Market
Sale vs List Price
This analysis was generated automatically from MLS data. For an in-depth, human-reviewed valuation, contact Joseph Sardella at josephsardella@gmail.com.